
Fig.3
- ID
- ZDB-FIG-190723-783
- Publication
- Wang et al., 2019 - Gene profiling of head mesoderm in early zebrafish development: insights into the evolution of cranial mesoderm
- Other Figures
- All Figure Page
- Back to All Figure Page
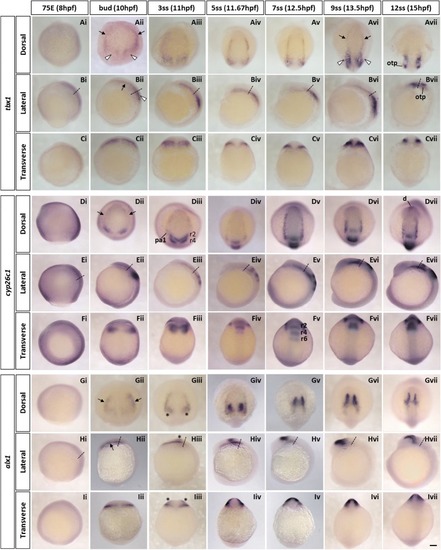
Spatio-temporal expression of cranial lateral mesoderm marker genes (tbx1, cyp26c1 and alx1) during zebrafish early development. A–IWhole-mount in situ hybridisation of zebrafish cranial lateral mesoderm marker genes. Embryos were hybridised with tbx1 (Ai–vii, Bi–vii, Ci–vii), cyp26c1 (Di–vii, Ei–vii, Fi–vii) and alx1 (Gi–vii, Hi–vii, Ii–vii) probes. Expression of all three genes in the cranial lateral mesoderm can be seen from bud- to 5-somite stage (Aii–iv, Dii–iv, Gii–iv, arrows). Black arrows indicate the cranial lateral mesoderm marked by the three genes. White arrowheads show the tbx1-expressing posterior region in the cranial paraxial mesoderm. Asterisks highlight the neural crest population labelled with alx1. In dorsal and lateral views, anterior is oriented to the top; in transverse views, dorsal side is oriented to the top. Transverse views were taken at the level indicated by the dashed lines in lateral views. 75E, 75% epiboly; d, diencephalon; hpf, hours post-fertilisation; otp, otic placode; r, rhombomere; ss, somite stage. Scale bar: 100 μm
|
| Genes: | |
|---|---|
| Fish: | |
| Anatomical Terms: | |
| Stage Range: | 75%-epiboly to 10-13 somites |