|
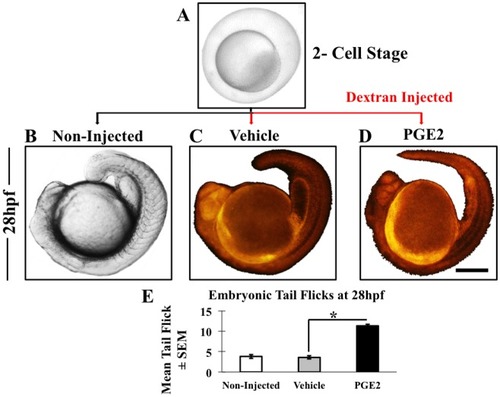
Microinjection and embryonic movement at 28 hpf. (A) We collected zebrafish eggs at the two-cell stage and a few non-injected embryos were kept as a reference (B). Only vehicle (C) and PGE2 (D) embryos were fluorescently labeled due to dextran injection. We monitored post-injection growth of embryos with both stereo and fluorescent microscopes and observed an increase in embryonic tail flicks in the PGE2 group (shown in Movie 1A-C). (E) From each biological replicate we selected some embryos to measure tail flicks. Chart showing the mean of embryonic tail flicks of non-injected (n=17), vehicle (n=26) and PGE2 (n=26) injected embryos±s.e.m. We conducted an unpaired t-test and results show a significant increase in tail flicks in PGE2 injected group compared to the vehicle with a two-tailed unpaired t-test, *P=0.0001. Scale bar: 5 μm in A; 25 μm in B,C,D.
|