
FIGURE
Figure 3
- ID
- ZDB-FIG-190723-227
- Publication
- Zarantoniello et al., 2019 - A six-months study on Black Soldier Fly (Hermetia illucens) based diets in zebrafish
- Other Figures
- All Figure Page
- Back to All Figure Page
Figure 3
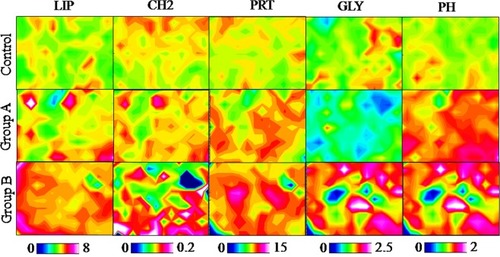
Example of imaging vibrational analysis of Control, Group A and Group B zebrafish liver samples. Topographical distribution of: lipids (LIP); saturated alkyl chains (CH2); proteins (PRT); glycogen (GLY) and phosphate groups (PH). Map size ~560 × 440 µm2. Zebrafish fed diet based on fish meal (Control) and diets with 25% (Group A) or 50% (Group B) replacement of fish meal with BSF meal. |
Expression Data
Expression Detail
Antibody Labeling
Phenotype Data
Phenotype Detail
Acknowledgments
This image is the copyrighted work of the attributed author or publisher, and
ZFIN has permission only to display this image to its users.
Additional permissions should be obtained from the applicable author or publisher of the image.
Full text @ Sci. Rep.