
- Title
-
A six-months study on Black Soldier Fly (Hermetia illucens) based diets in zebrafish
- Authors
- Zarantoniello, M., Randazzo, B., Truzzi, C., Giorgini, E., Marcellucci, C., Vargas-Abúndez, J.A., Zimbelli, A., Annibaldi, A., Parisi, G., Tulli, F., Riolo, P., Olivotto, I.
- Source
- Full text @ Sci. Rep.
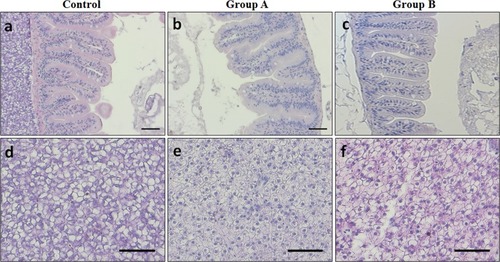
Example of histomorphology of adult zebrafish. ( |
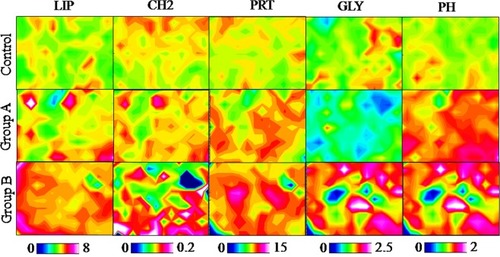
Example of imaging vibrational analysis of Control, Group A and Group B zebrafish liver samples. Topographical distribution of: lipids (LIP); saturated alkyl chains (CH2); proteins (PRT); glycogen (GLY) and phosphate groups (PH). Map size ~560 × 440 µm2. Zebrafish fed diet based on fish meal (Control) and diets with 25% (Group A) or 50% (Group B) replacement of fish meal with BSF meal. |