
FIGURE
Figure 2
- ID
- ZDB-FIG-190723-2187
- Publication
- Mathai et al., 2017 - Studying Autophagy in Zebrafish
- Other Figures
- All Figure Page
- Back to All Figure Page
Figure 2
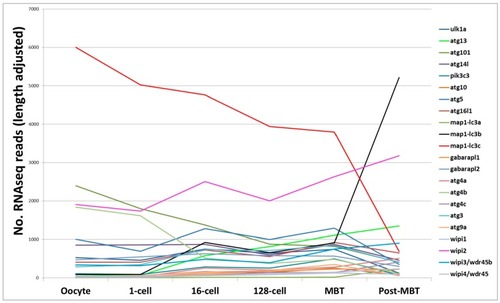
Messenger RNA sequence (mRNA-seq) analysis. Line plot of core autophagy gene transcripts analyzed by mRNA-seq in zebrafish embryos from the oocyte stage to post-mid blastula stage transition. |
Expression Data
Expression Detail
Antibody Labeling
Phenotype Data
Phenotype Detail
Acknowledgments
This image is the copyrighted work of the attributed author or publisher, and
ZFIN has permission only to display this image to its users.
Additional permissions should be obtained from the applicable author or publisher of the image.
Full text @ Cells