FIGURE

Fig. 1

ID
ZDB-FIG-190723-2132
Publication
Williams et al., 2016 - Zebrafish small molecule screens: Taking the phenotypic plunge
Other Figures
All Figure Page
Back to All Figure Page
Fig. 1

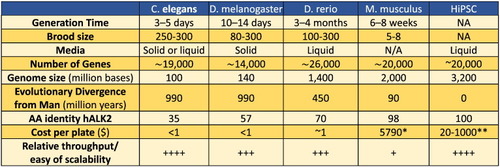
Comparison of model organisms used in phenotypic screens.

Commonly accepted numbers for generation time and brood size are listed, along with media for animal maintenance, evolutionary divergence, gene number and genome size [29]. Also listed, the evolutionary divergence from man and the amino acid sequence identity to the human BMP receptor ALK2 (hALK2). Unit cost: approximate cost of animals needed to screen a 96-well plate of compound libraries, in triplicate. *For mice, this is the approximate cost to purchase 288 mice from Jackson Labs. **Cost of iPSC varies significantly depending on differentiated cell type, culture methods and screening conditions. Relative throughput/ease of scalability: ++++, very high (close to in vitro HTS); +++, high (up to tens of thousands compounds/week); +, low (up to hundreds of compounds/week).

Expression Data

Expression Detail
Antibody Labeling
Phenotype Data

Phenotype Detail
Acknowledgments
This image is the copyrighted work of the attributed author or publisher, and ZFIN has permission only to display this image to its users. Additional permissions should be obtained from the applicable author or publisher of the image. Full text @ Comput Struct Biotechnol J