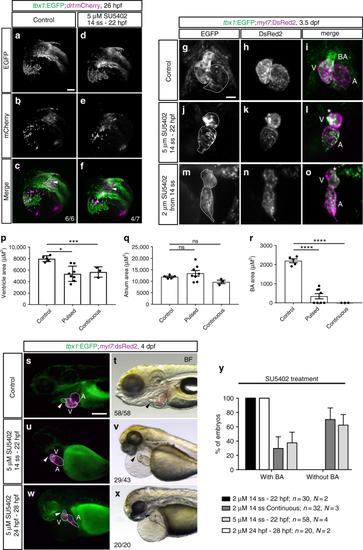
FGF signaling differentially affects tbx1+ ventricular and BA precursors. a–f Maximum intensity projections of representative tbx1:EGFP;drl:mCherry DMSO-treated controls or embryos treated with 5 µM SU5402 from 14 ss to 22 hpf; lateral/dorsal view, anterior to the left. FGF signaling-perturbed embryos show a defect in the tbx1:EGFP-expressing sheath (arrowhead) at the base of the forming heart tube (outline). g–o Maximum intensity projections of representative hearts of tbx1:EGFP;myl7:DsRed2 embryos, DMSO-treated controls (g–i, n = 5), treated with 5 µM SU5402 between 14 ss and 24 hpf (j–l, n = 8), or treated with 2 µM SU5402 continuously from 14 ss (m–o, n = 3); ventral views, anterior to the top, outlines mark the heart. FGF-perturbed embryos retain normal contribution of tbx1:EGFP-expressing cardiomyocytes to the ventricle upon pulsed or continuous signaling inhibition; ventricle (V), atrium (A), bulbus arteriosus (BA), and asterisks mark the missing BA upon SU5402 treatments. p–r Quantified ventricle, atrium, and BA area size in SU5402-treated embryos as in g–o. Pulsed (see j–l) or continuous (see m–o) FGF signaling inhibition diminishes ventricle size (p) and severely reduced to abolished addition of the tbx1 reporter-expressing BA (r). The atrium is not significantly affected (q). Means ± SEM. ns P > 0.05, *P ≤ 0.05, **P ≤ 0.01, ***P ≤ 0.001, and ****P ≤ 0.0001, unpaired t-test with Welch correction. s–y SU5402 treatments affect BA development in time- and concentration-dependent manner; n indicates the number of embryos analyzed per condition, N indicates the number of experiments performed. s–xtbx1:EGFP;myl7:DsRed transgenic controls and embryos treated with DMSO or 5 µM SU5402 during (14 ss–22 hpf) or after (24 hp–28 hpf) heart tube formation; lateral views, anterior to the left. Absent BA formation can only be observed in embryos treated with SU5402 from mid-somitogenesis to heart tube stages (arrowhead in u, v, compare to s, t), but not when signaling inhibition is initiated at 24 hpf (arrowhead in w, x). y Quantification of the concentration-dependent effect on BA formation in FGF signaling-perturbed tbx1:EGFP;myl7:Red or DAR-4M-stained myl7:EGFP transgenics (see Supplementary Fig. 7). For 5 µM SU5402 from 14 ss to 22 hpf, no BA in n = 29/43 as assessed by tbx1 reporter and n = 5/15 by DAR-4M, total n = 34/58, N = 4; DMSO-treated controls: normal BA in n = 58/58 by tbx1 reporter and n = 10/10 by DAR-4M, total n = 68/68, N = 4. Scale bars 50 µm (g, o), 100 μm (a–f, s–x)
|
