
FIGURE
Figure 6
- ID
- ZDB-FIG-190723-1369
- Publication
- Bergen et al., 2019 - Zebrafish as an Emerging Model for Osteoporosis: A Primary Testing Platform for Screening New Osteo-Active Compounds
- Other Figures
- All Figure Page
- Back to All Figure Page
Figure 6
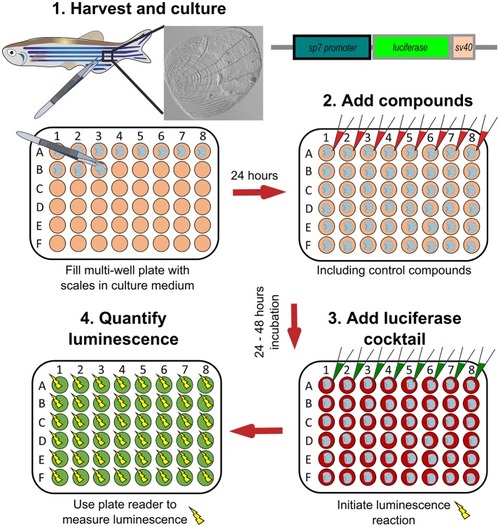
Schematic representation to show how osteoblast activity can be quantified from scales. Scales from |
Expression Data
Expression Detail
Antibody Labeling
Phenotype Data
Phenotype Detail
Acknowledgments
This image is the copyrighted work of the attributed author or publisher, and
ZFIN has permission only to display this image to its users.
Additional permissions should be obtained from the applicable author or publisher of the image.
Full text @ Front Endocrinol (Lausanne)