FIGURE

Figure 3

ID
ZDB-FIG-190723-1366
Publication
Bergen et al., 2019 - Zebrafish as an Emerging Model for Osteoporosis: A Primary Testing Platform for Screening New Osteo-Active Compounds
Other Figures
All Figure Page
Back to All Figure Page
Figure 3

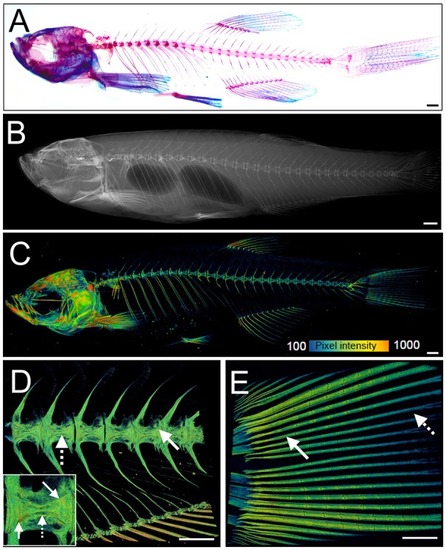
Examples of visualization and quantification of mineralized bone in zebrafish. (A) Wholemount Alizarin Red S (AR) and Alcian Blue staining of 3 months fixed fish. (B) Radiograph of 1-year old live fish showing whole body: endo- and exoskeleton. (C) Low resolution μCT images acquired with a 20 μm voxel size of a 3 months old fish. Note that pixel intensity can be used to determine BMD; represented on the color coded pixel intensity bar. (D,E) High resolution (5 μm voxel size) μCT images of vertebral column with anal fin rays (D) and caudal fin rays (E). Vertebral centrae have higher density at their edges (solid arrow) than the center (dashed arrow). In the fin rays, a higher density (solid arrow) is observed in older segments within the proximity to the body in comparison to younger segments located more caudally showing lower pixel intensity (dashed arrow). The same pixel intensity color coding as (C) applies. All fish and their insets are depicted from a lateral view in an anterior-posterior (left-right) orientation. Scale bars = 50 μm in (A,B); and 100 μm in (C–E).

Expression Data

Expression Detail
Antibody Labeling
Phenotype Data

Phenotype Detail
Acknowledgments
This image is the copyrighted work of the attributed author or publisher, and ZFIN has permission only to display this image to its users. Additional permissions should be obtained from the applicable author or publisher of the image. Full text @ Front Endocrinol (Lausanne)