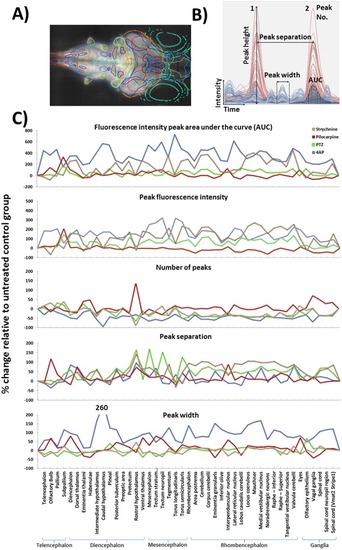
Results of the profile peak analysis. (A) Maximum intensity projection through a larva with overlays showing the positions of the 45 registered anatomical regions. (B) The various peak analysis parameters automatically quantified for each registered anatomical region, within each fish, are defined in panel B. For illustrative purposes only partial example profiles for a PTZ-exposed (red) and control fish (blue) are shown and the various parameters highlighted on these traces. (C) Peak profile analysis data for each region across treatments. The treatment group shown is that at which the highest activity was observed (Top concentrations for 4AP, pilocarpine and strychnine, and 2.5 mM for PTZ due to a slight dip in neural activity at the highest treatment level) Each data point is the mean across all fish/treatment group expressed as the % change versus the mean of the corresponding control group (F1−F0)/F0*100, where F1=treated group value, and F0=control group value. Note that for the AUC and the peak height profiles, 4AP data were divided by 10 to allow plotting on the same axis. Data also summarised in Supplementary Figure 5.
|
