
Figure 4
- ID
- ZDB-FIG-190723-112
- Publication
- Winter et al., 2018 - Author Correction: 4-dimensional functional profiling in the convulsant-treated larval zebrafish brain
- Other Figures
- All Figure Page
- Back to All Figure Page
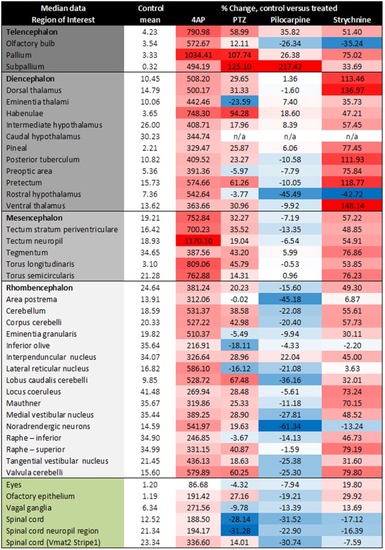
Summary of the voxel GCaMP6s fluorescence intensity obtained per anatomical region for each of the model chemoconvulsant compounds applied. Data are expressed as the time-averaged median fluorescence intensity values, averaged across all fish in that treatment group, expressed the % change versus the corresponding control fish group (second left column presented for brevity as the mean across the 4 control groups): ΔF/F = (F1−F0)/F0*100 (where F1=treated group fluorescence intensity, F0=control group fluorescence intensity). Colour coding represents the degree of activation (shades of red), or suppression (shades of blue) versus that region in the control larvae, relative to other brain regions within that treatment group. The treatment group shown is that at which the highest activity was observed, which was the top concentration for 4AP, pilocarpine and strychnine, but 2.5 mM (the second highest) for PTZ due to a slight dip in neural activity at the highest treatment level. Colour coding in the left most column represents anatomical categorisation as subdivisions of the telencephalon, diencephalon, mesencephalon and rhombencephalon, along with ganglia (green) respectively from top to bottom. n/a – values not obtained due to a failure in registration probably due to the high z-depth of this region. N = 8 larvae were imaged per group. For corresponding SEM values, see Supplementary Table 3. |