
Fig. 2
- ID
- ZDB-FIG-190716-12
- Publication
- Wu et al., 2019 - Liposome-Mediated Drug Delivery in Larval Zebrafish to Manipulate Macrophage Function
- Other Figures
- All Figure Page
- Back to All Figure Page
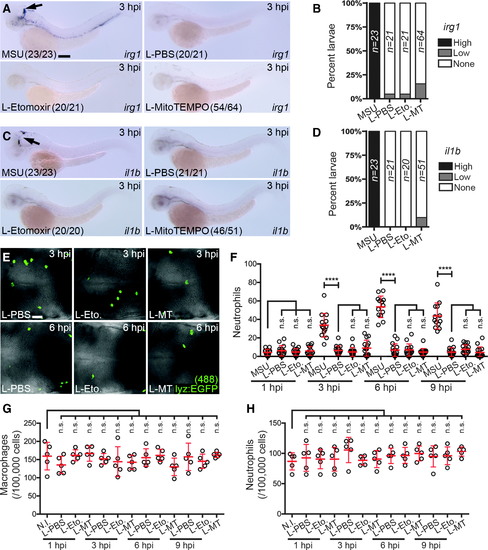
Injecting liposomes alone does not activate macrophages. (A)Expression of irg1 after injection of liposomal PBS (L-PBS), etomoxir (L-Etomoxir), or MitoTEMPO (L-MitoTEMPO), as detected at 3 hpi. MSU-injected larvae are included here as a positive control for comparison. (B)Temporal quantification of irg1 expression, as percent larvae displaying high (as shown in A), low, and no expression (none). (C) Expression of il1bafter injection of L-PBS, L-Etomoxir, and L-MitoTEMPO, as detected at 3 hpi. MSU-injected larvae are included here as a positive control for comparison. (D) Temporal quantification of il1b expression, as percent larvae displaying high (as shown in C), low, and no expression (none). (E)Immunofluorescence detection of neutrophils within the hindbrain region of Tg(lyz:EGFP) larvae after L-PBS, L-Etomoxir (L-Eto.) or L-MitoTEMPO (L-MT) injection, as detected at 3 and 6 hpi. (F) Temporal quantification of neutrophils, as detected in (E), compared with MSU crystal-injected larvae (n = 13–15 larvae/treatment). (G, H) Flow cytometry quantification of macrophages (G) and neutrophils (H) from Tg(mpeg1:EGFP) and Tg(lyz:EGFP) larvae, respectively, after L-PBS, L-Etomoxir (L-Eto.), or L-MitoTEMPO (L-MT) injection (compared with N.I. larvae), quantified at 1, 3, 6, and 9 hpi. Black arrows mark irg1- and il1b-expressing macrophages in hindbrain. All views anterior to left. Error bars display mean ± SD. ****p < 0.0001, one-way ANOVA, Dunnett's post hoc test. Scale bars, 100 μm in (A) and 50 μm in (E). ANOVA, analysis of variance; MSU, monosodium urate; N.I., noninjected; n.s, not significant. |