
FIGURE
Fig. 3
- ID
- ZDB-FIG-190703-12
- Publication
- Kuil et al., 2019 - Reverse genetic screen reveals that Il34 facilitates yolk sac macrophage distribution and seeding of the brain
- Other Figures
- All Figure Page
- Back to All Figure Page
Fig. 3
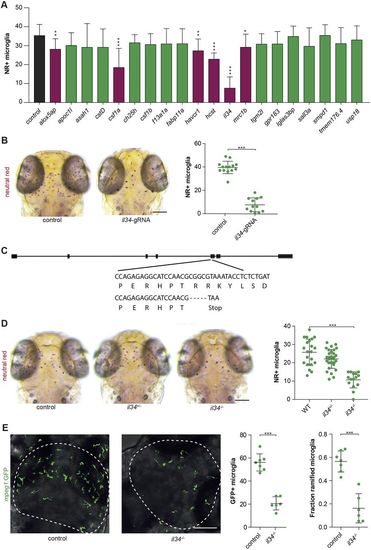
Reverse genetic screen reveals zebrafish il34 as a regulator of microglia development. (A) Accumulated data from all gRNA injections showing the number of NR+microglia as quantified with SpotNGlia. Magenta bars represent genes showing a significant reduction in microglia numbers upon CRISPR/Cas9-based targeting (black bar, control; green bars, genes with non-significant reduction in microglia numbers). (B) NR+ microglia numbers in 3 dpf zebrafish larvae injected with gRNA-Cas9 RNPs targeting il34. Controls in A and B are non-injected WT larvae. (C) A −5 bp deletion in exon 1 of il34 directly introduces a stop codon. (D) NR+microglia numbers in il34 mutants with a premature stop codon in exon 5 and their heterozygous and WT siblings at 3 dpf. (E) GFP+ microglia in the optic tecti (dashed lines) of 3 dpf il34 mutants and controls, and quantification of their numbers and the fraction of microglia containing more than one protrusion (ramified microglia). Controls in D and E are WT (il34+/+) larvae. *P<0.05, **P<0.01, ***P<0.001. One-way ANOVA and Student's t-test. Bonferroni correction for multiple testing. Scale bars: 100 µm. Each dot represents one larva. Error bars represent s.d. |
Expression Data
| Gene: | |
|---|---|
| Fish: | |
| Anatomical Term: | |
| Stage: | Protruding-mouth |
Expression Detail
Antibody Labeling
Phenotype Data
| Fish: | |
|---|---|
| Knockdown Reagents: | |
| Observed In: | |
| Stage: | Protruding-mouth |
Phenotype Detail
Acknowledgments
This image is the copyrighted work of the attributed author or publisher, and
ZFIN has permission only to display this image to its users.
Additional permissions should be obtained from the applicable author or publisher of the image.
Full text @ Dis. Model. Mech.