
FIGURE
Fig. 2
- ID
- ZDB-FIG-190703-11
- Publication
- Kuil et al., 2019 - Reverse genetic screen reveals that Il34 facilitates yolk sac macrophage distribution and seeding of the brain
- Other Figures
- All Figure Page
- Back to All Figure Page
Fig. 2
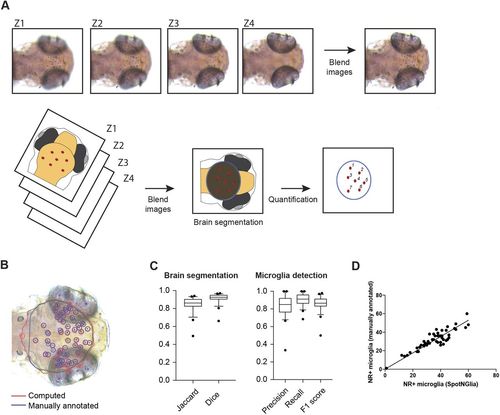
SpotNGlia semi-automatically counts microglia numbers. (A) Examples of z-stack images of NR-stained larvae and a schematic representation of the SpotNGlia analysis pipeline. (B) SpotNGlia output of test dataset with both manual (blue) and automated (red) brain segmentation and NR+ microglia annotation. (C) Box plots showing Jaccard and Dice indices for accuracy of brain segmentation and F1, precision and recall scores for the accuracy of NR+microglia annotation. This is a Tukey boxplot: it uses the median and interquartile range (IQR) for the box. The whiskers extend to the most extreme data within 1.5×IQR. Data outside 1.5×IQR are considered outliers. (D) Correlation between manually and automated microglia quantification after manual correction for segmented brain area. Error bars represent s.d. |
Expression Data
Expression Detail
Antibody Labeling
Phenotype Data
Phenotype Detail
Acknowledgments
This image is the copyrighted work of the attributed author or publisher, and
ZFIN has permission only to display this image to its users.
Additional permissions should be obtained from the applicable author or publisher of the image.
Full text @ Dis. Model. Mech.