
FIGURE
Fig. 2
- ID
- ZDB-FIG-190627-21
- Publication
- Tabor et al., 2019 - Brain-wide cellular resolution imaging of Cre transgenic zebrafish lines for functional circuit-mapping
- Other Figures
- All Figure Page
- Back to All Figure Page
Fig. 2
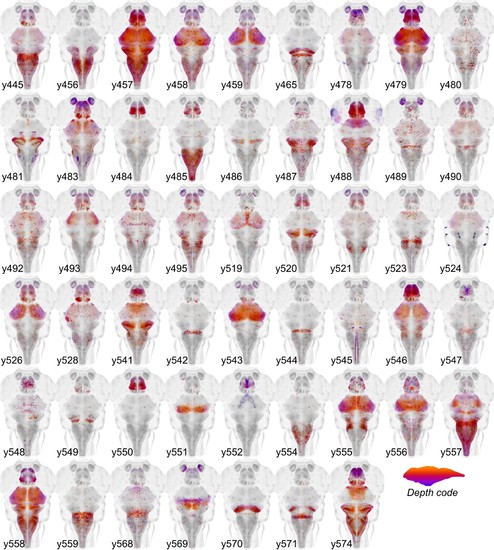
Cre enhancer trap lines.Horizontal maximum projection of 52 new Cre enhancer trap lines, with color indicating depth along the dorsal-ventral dimension (huC counter-label, grey). |
Expression Data
Expression Detail
Antibody Labeling
Phenotype Data
Phenotype Detail
Acknowledgments
This image is the copyrighted work of the attributed author or publisher, and
ZFIN has permission only to display this image to its users.
Additional permissions should be obtained from the applicable author or publisher of the image.
Full text @ Elife