
Fig. 4
- ID
- ZDB-FIG-190618-16
- Publication
- Borga et al., 2018 - Simultaneous B and T cell acute lymphoblastic leukemias in zebrafish driven by transgenic MYC: implications for oncogenesis and lymphopoiesis
- Other Figures
- All Figure Page
- Back to All Figure Page
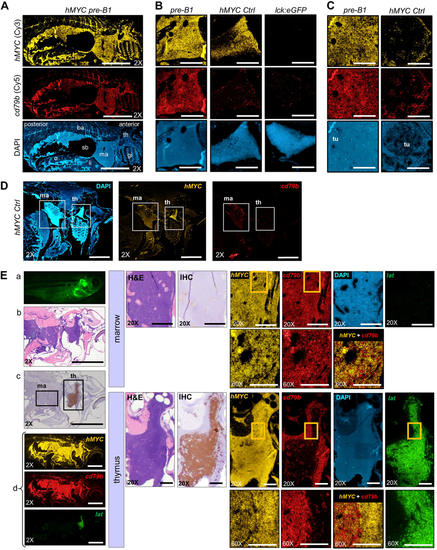
Pre-B ALL co-express hMYC and B cell-specific cd79b. RNA ISH for hMYC (yellow) and cd79b (red) in: A sagittally-sectioned hMYC pre-B ALL (pre-B1; scale bar = 2 mm), B Thymi of pre-B1 (left), hMYC control (center), and lck:GFP (WT) control (right; scale bar = 200 μm), C Kidney-marrow of pre-B1 (left) and hMYC control (right). Kidney tubules (tu) are displaced by pre-B1ALL cells in marrow DAPI image (scale bar = 200 μm), D hMYC control (scale bar = 1 mm). E Second hMYC fish with pre-B ALL and localized thymic T-ALL. Left: (a) High-exposure microscopy, (b) H&E, (c) anti-GFP IHC, (d) RNA ISH for hMYC (yellow), cd79b (red) and lat (green). Middle: high-power of kidney-marrow (top) and thymus (bottom) by H&E, anti-GFP IHC. Right:hMYC, cd79b, and lat, RNA ISH. Boxed regions in 20X marrow and thymus panels are enlarged in the 60× images directly beneath them. Merged hMYC+cd79b images are also shown. 2× scale bar = 2 mm; 20× bar = 200 µm; 60× bar = 100 µm. Abbreviations as in Fig. 3, and o= ovary, ba= back, sb= swim bladder
|
| Gene: | |
|---|---|
| Fish: | |
| Anatomical Terms: | |
| Stage: | Adult |