
Fig. 3
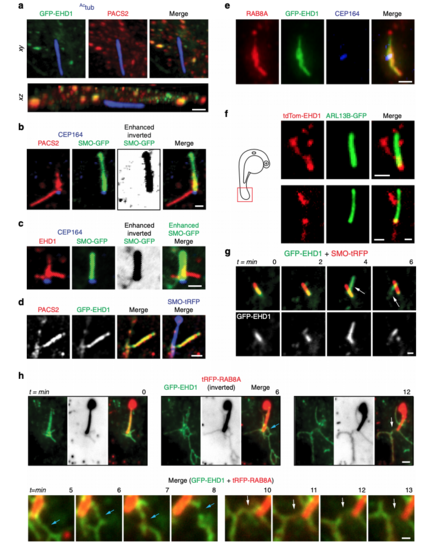
PACSIN and EHD proteins accumulate on CPM tubules that contain RAB8A. a Representative 3D volume view images (generated by SlideBook) of GFP-EHD1 cells serum starved for 24 h and stained with antibodies to PACSIN2 and Actub. The z-stack was captured using a SDC microscope and a CMOS camera. b, c SMO-GFP cells imaged as in a and stained with antibodies to PACSIN2 or EHD1, CEP164, and anti-GFP. Contrast enhanced and inverted image in the middle right panel demonstrate the absence of SMO-GFP in PACSIN2/EHD1 tubules. d Representative N-SIM maximum intensity projection images of CPM-associated membrane tubules in ciliated GFP-EHD1 (green) + SMO-tRFP (pseudo-colored blue) cells stained with PACSIN2 antibody (pseudo-colored red). e Epifluorescence projected z-stack images of a GFP-EHD1-positive CPM-tubule in ciliated cells stained with RAB8A and CEP164 antibodies highlighting the presence of endogenous RAB8A in both the ciliary membrane and the CPM tubules (7 cells). f Representative image of CPM-associated membrane tubules in tail cilia of 24 hpf zebrafish embryos expressing tdTom-EHD1 and ARL13B-GFP imaged by SDC microscope with a CMOS camera. Tail region is represented by red box in schematic of zebrafish embryo on the left. g GFP-EHD1 + SMO-tRFP cells were starved for 24 h and imaged live every 2 min (16 ciliated cells). Arrows mark dynamic tubules associated with the CPM over time. h GFP-EHD1 cells transiently transfected with tRFP-RAB8A, starved for 24 h, and imaged live using TIRF-M (upper panels). tRFP-RAB8A signal is shown inverted (middle images) and in red (merged right images). Arrows indicate breaks in membrane tubules. Scale bar: 1 μm. Enlarged regions (lower panels) from upper images showing membrane tubule breaks with additional time-lapse images added (12 cilia). Scale bar: 500 nm. Images in (g) and (h) are single xy planes. Scale bars: 1 μm for all images unless specified |