
Fig. 2
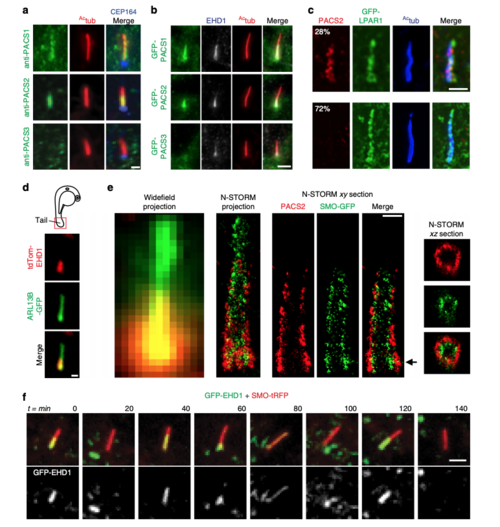
PACSIN and EHD proteins display dynamic CPM trafficking. a Representative images of RPE-1 cells serum starved for 24 h and stained with antibodies for PACSINs, Actub, and CEP164. PACSIN2 antibody showed lower levels of background staining in RPE-1 cells as compared to the PACSIN1 antibody. b Representative images of GFP-PACSINs expressed in RPE-1 cells as in a and stained with antibodies for EHD1 and Actub. Note that GFP-PACSIN1 and GFP-PACSIN2 always co-localized with EHD1 (GFP-PACSIN1 = 85, GFP-PACSIN2 = 90 cells). SDC images in a and b are maximum intensity z-projections. Scale bar: 2 μm. c N-SIM images of cilia from cells transiently transfected with GFP-LPAR1, serum starved for 24 h, and stained with Actub and PACSIN2 antibodies. Images are single xy planes. Scale bar: 2 μm. dRepresentative image of tdTom-EHD1 and the ciliary membrane marker ARL13B-GFP expressed in a cilium from the tail region (red box in schematic; top panel) of a 24 hpf embryo. SDC images are maximum intensity z-projections. Scale bar: 1 μm. eRepresentative images of epifluorescence (left panel) and N-STORM projections (middle left panel) from 24 h serum-starved SMO-GFP RPE-1 cells stained with PACSIN2 antibody as described in Methods. Images of a single xy plane bisecting the cilium (middle right panels). Orthogonal views of N-STORM images corresponding to the black arrow (right panels). Scale bar: 300 nm. f GFP-EHD1 + SMO-tRFP cells were serum starved for 24 h and imaged live every 20 min. Images are single xy planes (30 ciliated cells). Scale bar: 2 μm |