
Fig. S4
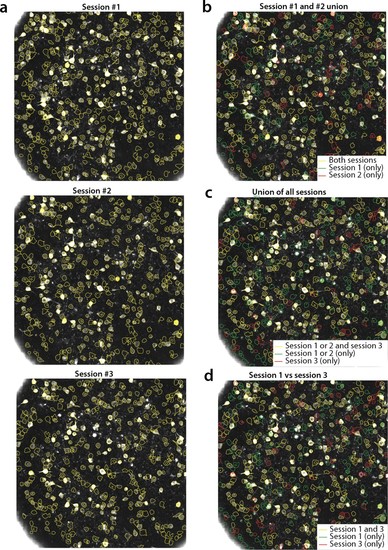
Tracking neurons across days; step-by-step description of multi session registration.(a) Correlation image overlaid to contour plots of the neurons identified by in day 1 (top, 453 neurons), 2 (middle, 393 neurons) and 3 (bottom, 375 neurons). (b) Result of the pairwise registration between session 1 and 2. The union of distinct active components consists of the components that were active in i) both sessions (yellow - where only the components of session two are displayed), ii) only in session 2 (green), and iii) only in session 1 (red), aligned to the FOV of session 2. (c) At the next step the union of sessions 1 and 2 is registered with the results of session three to produce the union of all distinct components aligned to the FOV of session 3. (d) Registration of non-consecutive sessions (session 1 vs session 3) without pairwise registration. Keeping track of which session each component was active in enables efficient and stable comparisons. |