
FIGURE
Fig. 3
Fig. 3
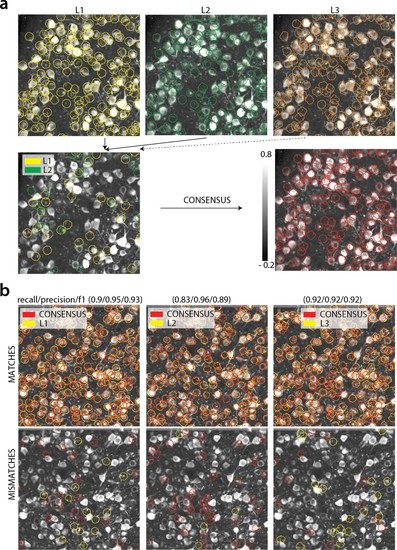
(a) Top: Individual manual annotations on the dataset K53 (only part of the FOV is shown) for labelers L1 (left), L2 (middle), L3(right). Contour plots are plotted against the max-correlation image of the dataset. Bottom: Disagreements between L1 and L2 (left), and consensus labels (right). In this example, consensus considerably reduced the number of initially selected neurons. (b) Matches (top) and mismatches (bottom) between each individual labeler and consensus annotation. Red contours on the mismatches panels denote false negative contours, that is components in the consensus not selected by the corresponding labeler, whereas yellow contours indicate false positive contours. Performance of each labeler is given in terms of precision/recall and F1 score and indicates an unexpected level of variability between individual labelers.
|
Expression Data
Expression Detail
Antibody Labeling
Phenotype Data
Phenotype Detail
Acknowledgments
This image is the copyrighted work of the attributed author or publisher, and
ZFIN has permission only to display this image to its users.
Additional permissions should be obtained from the applicable author or publisher of the image.
Full text @ Elife