
Fig. 4
- ID
- ZDB-FIG-190416-2
- Publication
- Migault et al., 2018 - Whole-Brain Calcium Imaging during Physiological Vestibular Stimulation in Larval Zebrafish
- Other Figures
- All Figure Page
- Back to All Figure Page
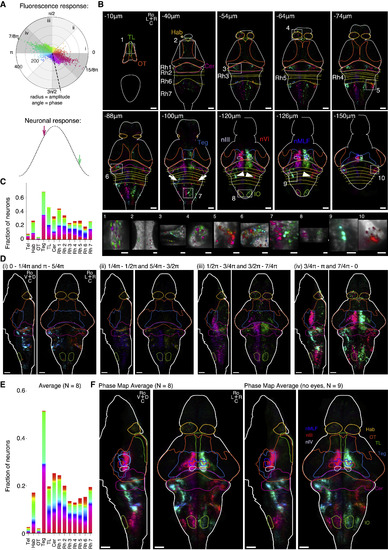
Phase Maps of Functional Brain-wide Response to Sinusoidal Vestibular Rolling Stimulation, Paralyzed Fish (A) Top: polar plot of the fluorescence response amplitude per neuron measured in units of signal to noise (STAR Methods) and plotted against the phase delay of the response relative to the stimulus. The color code indicates the phase shift. The dashed line indicates the expected position of a zero-phase-shift neuronal signal once corrected for the phase delay introduced by the GCaMP6s sensor (STAR Methods). Bottom: schematic showing one stimulus cycle (black dashed). Arrows indicate the phase in the cycle where the neurons with the dominant response (black line, top) have their maximal response when taking into account the delay introduced by the GCaMP6s sensor. (B) Top: ten selected phase map layers of an example fish after registration on the Z-Brain reference brain. The delineated brain areas are from the Z-Brain atlas. Bottom: close-up views of regions shown by the dashed rectangles. (C) Fractions of responding neurons and the corresponding phase-shift distribution in the 13 selected brain areas. (D) Maximum-projection views of the phase map shown in (B) and separated into the four phase intervals depicted in (A). For each phase interval, a maximum projection from left to the midline and from dorsal to ventral is shown. (E) Fraction of responding neurons and the corresponding phase distribution for the 13 selected brain areas. (F) Average phase maps. Left: average of N = 8 paralyzed fish. Right: average of N = 9 bi-enucleated paralyzed fish. Maximum projections from left to the midline and from dorsal to ventral are shown. C, caudal; D, dorsal; Hab, habenula; IO, inferior olive; L, left; R, right; Ro, rostral; TL, torus longitudinalis; Teg, tegmentum; nMLF, nuclear medial fasciculus; nIII, oculomotor nucleus; nIV, trochlear nucleus; Cer, cerebellum; V, ventral; Rh, rhombomere. All data were recorded in Tg(elavl3:H2B-GCaMP6s) fish. Scale bars, 50 μm and 20 μm (close-up views in B). See also Figures S2–S4 and Videos S3 and S4. |