
Fig. 1
- ID
- ZDB-FIG-190416-1
- Publication
- Migault et al., 2018 - Whole-Brain Calcium Imaging during Physiological Vestibular Stimulation in Larval Zebrafish
- Other Figures
- All Figure Page
- Back to All Figure Page
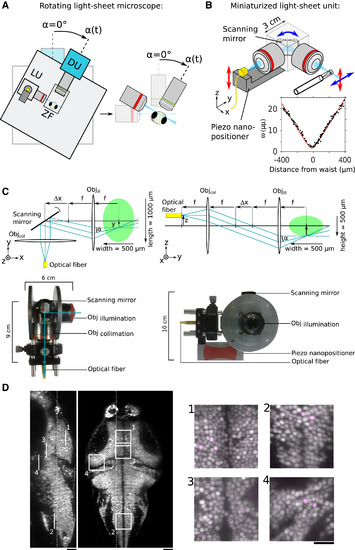
Experimental Setup and Imaging Performance (A) Schematic of the rotating microscope setup with the light-sheet unit (LU), mounted zebrafish (ZF), and detection unit (DU). The close-up image illustrates how the fish rotates together with the microscope such that the light sheet and the detection focal plane coincide for any rotation angle. Stimulation angles are counted as positive in the direction indicated by the arrow. The fish faces the breadboard with its long body axis aligned with the microscope rotation axis. (B) Schematic of the light-sheet-forming unit. Inset: measured light-sheet profile (black) and adjusted with the theoretical Gaussian beam profile (red). (C) Details of the light-sheet unit. The left part illustrates in a top view the scanning mechanism for the light-sheet formation. The right part illustrates in a side view the ray diagram for the z scanning of the light sheet. The scanning mirror is omitted for clarity. The green ellipse schematizes the fluorescent zebrafish brain. The photographs of the light-sheet unit corresponding to top and side views are shown below the two schemes. The two metallic disks allow rotating the unit for alignment. (D) Sagittal and coronal sections of a volumetric whole-brain scan of a 6-day-old zebrafish larva with pan-neuronal GCaMP6s expression (Tg(elavl3:H2B-GCaMP6s)). The four insets show quasi-single-cell resolution and the result of the automatic segmentation process. Scale bars, 50 μm (main image) and 25 μm (insets). |