
Fig. 7
- ID
- ZDB-FIG-190403-7
- Publication
- Verbueken et al., 2018 - From mRNA Expression of Drug Disposition Genes to In Vivo Assessment of CYP-Mediated Biotransformation during Zebrafish Embryonic and Larval Development
- Other Figures
- All Figure Page
- Back to All Figure Page
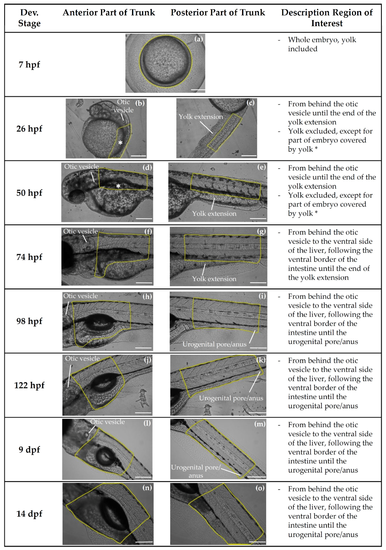
Description of region of interest used for the quantitative and qualitative analysis of resorufin formation in zebrafish embryos and larvae at 7 h post-fertilization (hpf) (a), 26 hpf (b,c), 50 hpf (d,e), 74 hpf (f,g), 98 hpf (h,i), 122 hpf (j,k), 9 d post-fertilization (dpf) (l,m) and 14 dpf (n,o) after exposure to benzyloxy-methyl-resorufin (BOMR) or 7-ethoxyresorufin (ER). The yellow frame indicates the region of interest in the embryo or larva. Since for most embryos/larvae the complete trunk region did not fit within one image, pictures of anterior and posterior trunk were taken separately. For the quantitative analysis of resorufin formation in each embryo/larva, average pixel intensities of anterior and posterior trunk images were combined. Figure 7 (a) shows a vegetal pole view of the embryo. In Figure 7 (b–o) lateral views of the anterior and posterior part of the trunk region are shown. Scale bar: 200 µm; (b,c): anterior top and dorsal right; (d–o): anterior left and dorsal top. |