
FIGURE
Fig. 4
- ID
- ZDB-FIG-190114-3
- Publication
- Liu et al., 2018 - Toxicity Evaluation and Biomarker Selection with Validated Reference Gene in Embryonic Zebrafish Exposed to Mitoxantrone
- Other Figures
- All Figure Page
- Back to All Figure Page
Fig. 4
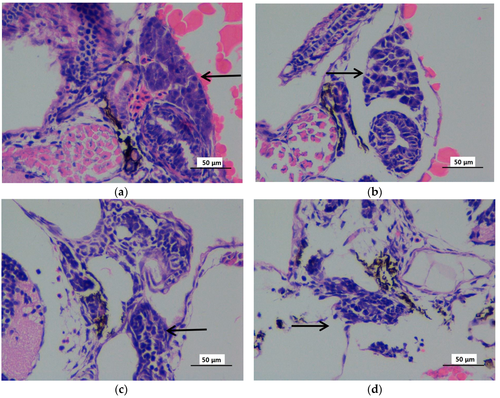
The hematoxylin-eosin staining microphotographs of zebrafish liver (72 hpf) exposed to gradient concentrations of mitoxantrone (×400). The zebrafish embryos exposed to 0 (a), 10 (b), 50 (c) and 100 (d) μg/L mitpxantrone were observed at 72 hpf with hematoxylin–eosin staining. The black arrow indicated the liver tissues. The scale bar indicated 50 μm. |
Expression Data
Expression Detail
Antibody Labeling
Phenotype Data
Phenotype Detail
Acknowledgments
This image is the copyrighted work of the attributed author or publisher, and
ZFIN has permission only to display this image to its users.
Additional permissions should be obtained from the applicable author or publisher of the image.
Full text @ Int. J. Mol. Sci.