
Image
|
Figure Caption
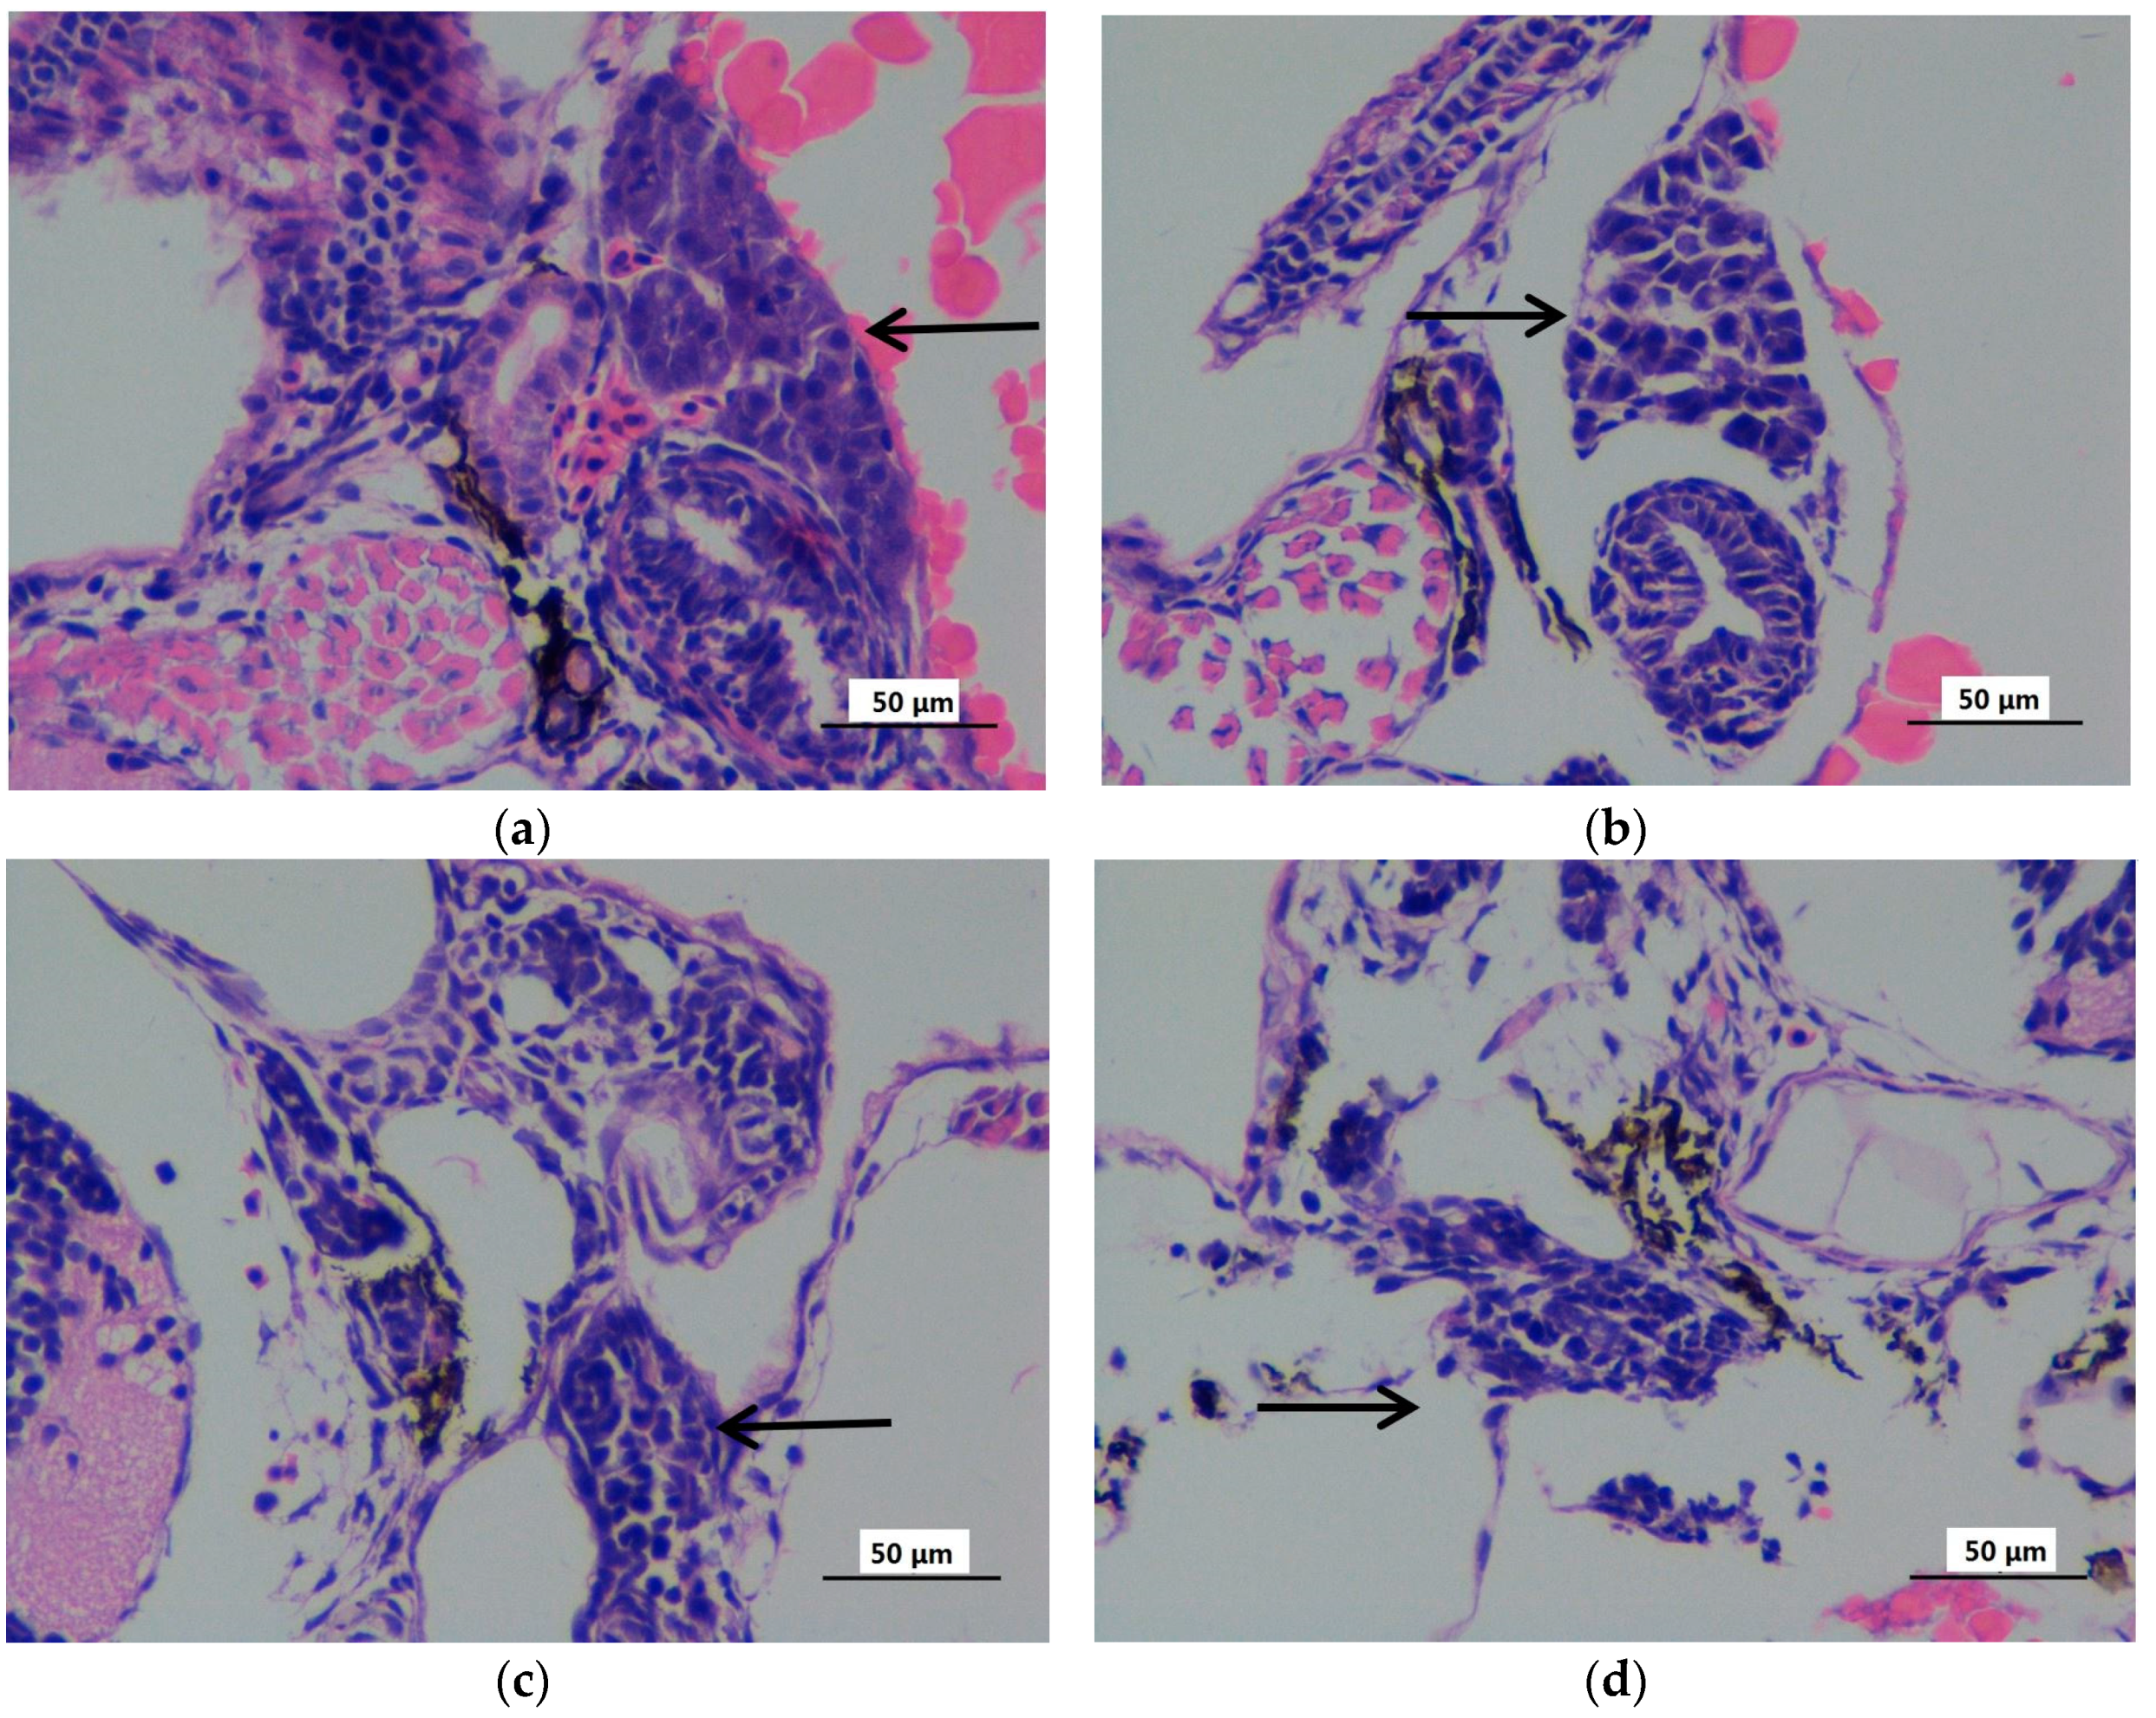
Fig. 4
The hematoxylin-eosin staining microphotographs of zebrafish liver (72 hpf) exposed to gradient concentrations of mitoxantrone (×400). The zebrafish embryos exposed to 0 (a), 10 (b), 50 (c) and 100 (d) μg/L mitpxantrone were observed at 72 hpf with hematoxylin–eosin staining. The black arrow indicated the liver tissues. The scale bar indicated 50 μm.