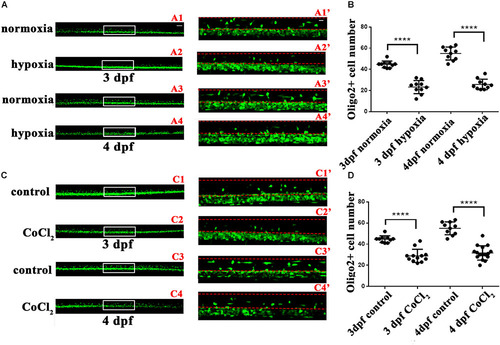
Hypoxia and CoCl2⋅6H2O suppressed OPC migration to the dorsal area. The number of dorsally migrated spinal cord olig2+ cells was counted in Tg (olig2: EGFP) zebrafish using a 10 × objective lens on a FV1000 microscope (Olympus, Tokyo, Japan). (A,B) The number of dorsally migrated olig2+ cells decreased under hypoxia at 3 and 4 dpf. A1′, A2′, A3′, and A4′ are the magnified pictures of the white boxes in A1, A2, A3, and A4. Two-way ANOVA, P < 0.0001: Student’s two-tailed t-test. Significantly more cells were dorsally migrated in 3-dpf normoxic larvae as compared to 3-dpf hypoxic larvae (n = 10; P < 0.0001). Significantly more cells were dorsally migrated in 4-dpf normoxic larvae as compared to 4-dpf hypoxic larvae (n = 10; P < 0.0001). (C,D) The number of dorsally migrated spinal cord olig2+ cells in 3- and 4-dpf larvae decreased after CoCl2⋅6H2O exposure. C1′, C2′, C3′, and C4′ are the magnified pictures of the white boxes in C1, C2, C3, and C4. Two-way ANOVA, P < 0.0001: Student’s two-tailed t-test. Significantly more cells were dorsally migrated in 3-dpf normoxic larvae as compared to 3-dpf hypoxic larvae (n = 10; P < 0.0001). Significantly more cells were dorsally migrated in 4-dpf normoxic larvae as compared to 4-dpf hypoxic larvae (n = 10; P < 0.0001). The dashed line indicates the dorsal spinal cord. Scale bars: A1–A4 and C1–C4, 50 μm; A1′–A4′, and C1′–C4′, 10 μm. ∗P < 0.05; ∗∗P < 0.01; ∗∗∗P < 0.001. Error bars represent S.E.M.
|
