
Fig. 5
- ID
- ZDB-FIG-181109-6
- Publication
- Romero et al., 2018 - Damage-induced reactive oxygen species enable zebrafish tail regeneration by repositioning of Hedgehog expressing cells
- Other Figures
- All Figure Page
- Back to All Figure Page
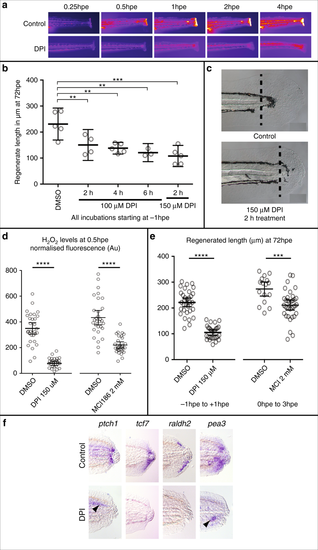
ROS activity immediately after tail excision. a Time course showing production of ROS after tail excision is reduced in larvae treated with 150 μM DPI from 1 h prior to excision. Larvae were bathed in 10 μM PFBS-F (205429, Santa Cruz) to detect ROS. b Optimisation to show that treatment for as little as 2 h (1 h pretreatment and 1 h post-treatment) is sufficient to reduce tail regrowth by >50%. Regrowth was quantified from images using the Measure macro in ImageJ by placing a rectangle parallel to the body that started at the end of the notochord and finished at the caudal end of the fin fold. Significance was calculated using one-way ANOVA with Dunnett’s multiple comparisons test and each sample compared to the DMSO control (DMSO n = 5; 100 μM DPI/2 h n = 4 and P = 0.0096; 100 μM DPI/4 h n = 5 and P = 0.0018; 100 μM DPI/6 h n = 3, P = 0.0015; 150 μM DPI/2 h n = 5, P = 0.0001; number of experiments = 1). c Representative larval tails showing the extent of tail regrowth after DPI treatment. d Quantification of PFBS-F fluorescence shows that DPI treatment has a stronger effect on ROS levels than MCI186. Thirty larvae were analysed for each sample except for DPI which had only 29 (number of experiments = 2). **** indicates P < 0.0001. e Comparison of the efficacy of DPI to MCI186 in regards to regenerated tail length. Measurements were made as in panel a (DMSO n = 33, DPI n = 29, number of experiments = 3) (DMSO n = 16, MCI186 n = 33; number of experiments = 3). **** indicates P < 0.0001, *** indicates P = 0.005. f DPI treatment inhibits wound-induced activation of the Hedgehog, Wntβ-Catenin, RA and FGF pathways. Larvae were pretreated with 150 μM DPI for 1 h and for 6 hpa in 100 μM DPI. Larvae were then washed in E3 buffer and incubated until 24 hpa or 48 hpf in the case of tcf7 (ptch1 19/19, tcf7 7/9, raldh2 13/19, pea3 9/9). Arrowheads point to expression of pea3 and ptch1 that is found in unoperated animals (see also Supplementary Figure 2) |