
Fig. S1
- ID
- ZDB-FIG-181030-46
- Publication
- Zimmermann et al., 2018 - Zebrafish Differentially Process Color across Visual Space to Match Natural Scenes
- Other Figures
- All Figure Page
- Back to All Figure Page
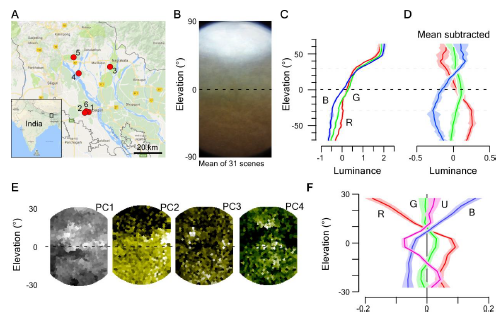
Distribution of chromatic content in the zebrafish natural visual world. Related to Figure 1. A, Location of field sites visited in West Bengal, India. B, Mean of n=31 action camera images and C, mean z-normalised brightness of the red, green and blue camera channels across these scenes. D, As (C), with mean between all 3 channels subtracted to highlight the differences between the three channels. Errors in C,D in s.e.m. E, Principal components 1-4 (left to right) of the hyperspectral example image shown in Figure 1J, (cf. Figure 1B-D). F, Achromatic-mean-subtracted mean luminance of the 4 opsin channels from the same scene (like in D). Errors in s.e.m.. |