
Fig. S6
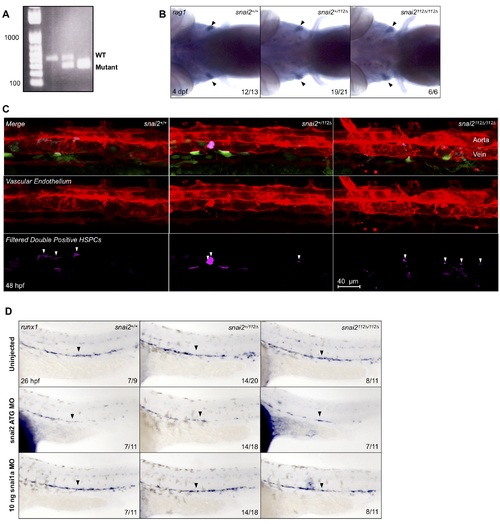
Snai2112Δ further analysis. A representative gel image shows the different banding pattern observed when genotyping embryos from a snai2+/112Δ in-cross (A). In order to assess later stages of embryonic hematopoiesis, we assessed expression of the T-cell marker, rag1, in 4 dpf embryos (B). Wild-types, heterozygotes, and mutants all showed normal rag1 staining. When snai2 mutants were analyzed on the Tg(CD41:GFP/kdrl:mCherry) background, we simultaneously injected a portion of the clutch analyzed with SB MO. These embryos were imaged via confocal microscopy and Imaris imaging software was used to remove GFP signal outside of the vasculature (C) alongside their uninjected siblings shown in Fig 7D. Quantification is shown in Fig 9D. Additionally, expression of the HSC specification marker, runx1, was analyzed by in situ hybridization at ~26 hpf in embryos injected with snai2 ATG MO, snai1a morpholino (MO), and their siblings. Black arrowheads point to the middle of the aortic runx1 expression. Numbers in the lower right-hand corner of each image depict the number of embryos with the phenotype pictured out of the total number of embryos assayed in each condition. |