
FIGURE
Fig. 3
- ID
- ZDB-FIG-181003-32
- Publication
- Lapierre-Landry et al., 2018 - Imaging Melanin Distribution in the Zebrafish Retina Using Photothermal Optical Coherence Tomography
- Other Figures
- All Figure Page
- Back to All Figure Page
Fig. 3
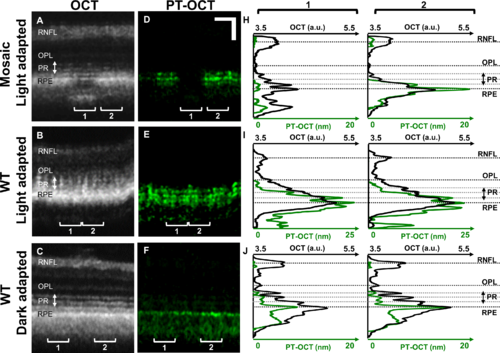
OCT and PT-OCT signal in the zebrafish retina as a function of depth. OCT (A–C) and PT-OCT (D–F) B-scans of light-adapted tyrosinase-mosaic zebrafish (top), WT light-adapted zebrafish (middle), and WT dark-adapted zebrafish (bottom) with LRP (OCT, black) and LAP (PT-OCT, green) for each ROI (H–J) 1 (left) and 2 (right). Each ROI is averaged over 20 adjacent A-scans. In (H), ROI 1 is nonpigmented, and ROI 2 is pigmented. Scale bar: 50 μm.
|
Expression Data
Expression Detail
Antibody Labeling
Phenotype Data
Phenotype Detail
Acknowledgments
This image is the copyrighted work of the attributed author or publisher, and
ZFIN has permission only to display this image to its users.
Additional permissions should be obtained from the applicable author or publisher of the image.
Full text @ Transl Vis Sci Technol