
Fig. 3
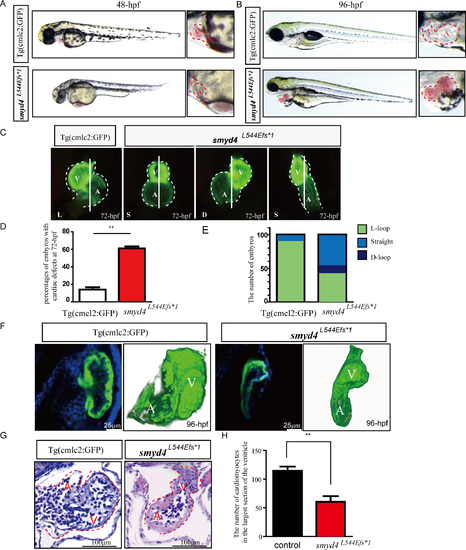
Phenotypical analyses of MZsmyd4L544Efs*1 embryos. (A) Representative images of the MZsmyd4L544Efs*1 and control embryos at 48 hpf, exhibiting congested blood flow in the ventral vein; (B) Representative images of the MZsmyd4L544Efs*1 and control embryos at 96 hpf, displaying severe pericardial edema; (C) Representative images of the MZsmyd4L544Efs*1 and control hearts at 72 hpf, demonstrating abnormal cardiac morphology and left-right looping defects; (D) Significantly more MZsmyd4L544Efs*1 embryos had abnormal cardiac development than control fish Tg (cmcl2:GFP) (61% ± 4.0% mutants vs. 14% ± 4.6% controls, n = 100, p < 0.01**); (E) Comparison of left-right patterning defects in the MZsmyd4L544Efs*1 (n = 100) and control (n = 100) embryos (green: normal L-loop; blue: straight; dark blue: D-loop). Only 10% of the control embryos showed an abnormal “straight” cardiac left-right asymmetry pattern. However, 48% of MZsmyd4L544Efs*1 embryos exhibited a “straight” left-right asymmetry pattern, and 11% showed a “D-loop” left-right asymmetry pattern; (F) Representative confocal images of the ventricular wall and 3D re-construction images of the MZsmyd4L544Efs*1 and control hearts at 96 hpf. The confocal scanned images demonstrated hypoplastic wall with significant reduction of trabeculation in MZsmyd4L544Efs*1 ventricle when compared to the wild-type control ventricle. The 3D-reconstruction of the hearts confirmed left-right looping defects in MZsmyd4L544Efs*1 hearts (For a better view of 3D-structures, see supplemental material S1 and S2 Movies). (G) Histological sections and H&E staining images of the MZsmyd4L544Efs*1 and control hearts at 96 hpf, demonstrating abnormal ventricular walls and reduced trabeculation; (H) The quantitative analysis of the number of cardiomyocytes in the ventricle displayed that MZsmyd4 L544Efs*1 had significantly reduced cardiomyocytes (p<0.01, **). |
| Fish: | |
|---|---|
| Observed In: | |
| Stage Range: | Long-pec to Day 4 |