
Fig. 3
- ID
- ZDB-FIG-180921-1
- Publication
- Song et al., 2018 - Developmental expression of the zebrafish Arf-like small GTPase paralogs arl13a and arl13b
- Other Figures
- All Figure Page
- Back to All Figure Page
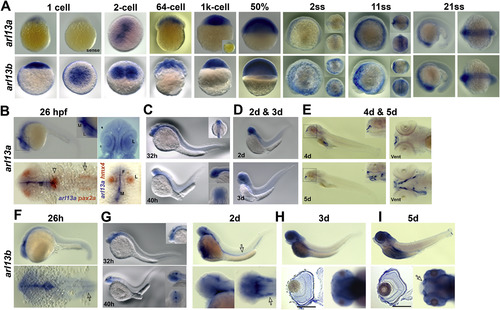
Developmental expression of zebrafish arl13a and arl13b from 1-cell to 5 dpf by in situ hybridization. (A) Expression patterns of arl13a (top row) and arl13b (bottom row) from 1-cell stage to 21 somite stage (ss) using antisense RNA probes. Control (sense) RNA probes for arl13a are shown for 1-cell stage and for the 1k-cell stage embryos (inset). Anterior is to the left. For images of 2ss and 11ss embryos, dorsal views (upper inset) and front views (lower inset) are also shown. Views of 21ss specimens are lateral and dorsal views, respectively. (B) Expression of arl13a at 26 hpf. The upper panels show views of an embryo following whole-mount in situ hybridization noting expression the CNS. Upper left shows lateral view and upper right image is a dorsal view. Lower images show two-color in situ hybridization with arl13a (blue) and pax2a or hmx4 (orange). Note that arl13a and pax2a expression domains do not overlap except in a small patch at the midbrain-hindbrain boundary (arrowhead). arl13a expression is excluded from the otic vesicle (open arrow) and in the lens, as noted by hmx4 expression. (D) Expression of arl13a by WISH at 2 dpf (top) and 3 dpf (bottom). (E) arl13a is highly expressed at upper lip (insets from the black rectangle) and lower lip (right image, ventral view) at 4 dpf, and at jaw at 5dpf (lower images, inset is the higher magnification from the black rectangle). F, forebrain; M, midbrain; L, lens; Vent, ventral view. (F–I) Expression patterns of arl13b from 26 hpf to 5 dpf. In F, the arrow indicates the otic vesicles; G, the arrow (upper images) indicates kidney and the arrow (lower right) indicates otic vesicle; H and I, higher expression of arl13b at photoreceptor layer at 3 dpf and 5 dpf (sections, lower left images, respectively). I, arrow indicates olfactory bulbs at 5 dpf (lower right). Scale bar: 100 μm. |
| Genes: | |
|---|---|
| Fish: | |
| Anatomical Terms: | |
| Stage Range: | 2-cell to Day 5 |
Reprinted from Gene expression patterns : GEP, 29, Song, P., Perkins, B.D., Developmental expression of the zebrafish Arf-like small GTPase paralogs arl13a and arl13b, 82-87, Copyright (2018) with permission from Elsevier. Full text @ Gene Expr. Patterns