
Fig. 2
- ID
- ZDB-FIG-180917-54
- Publication
- Vazquez Rodriguez et al., 2018 - Adipocytes Promote Early Steps of Breast Cancer Cell Dissemination via Interleukin-8.
- Other Figures
- All Figure Page
- Back to All Figure Page
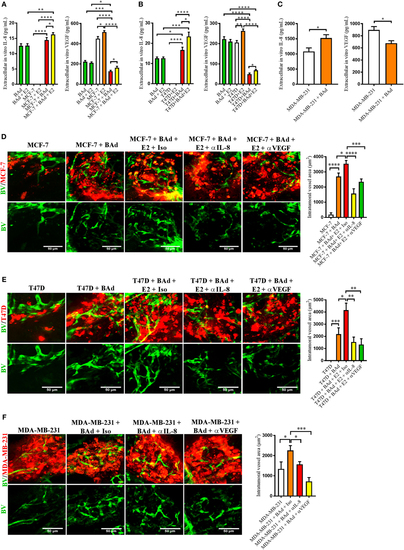
Addition of breast adipocytes (BAd) significantly increased interleukin-8 (IL-8) secretion but decreased vascular endothelial growth factor (VEGF) secretion compared to breast cancer cells (BCC) cultured alone and anti-IL-8 and anti-VEGF significantly decreased BAd-induced angiogenesis in primary tumors in zebrafish. BCC were cultured in 3D spheres alone or in combination with BAd. Secreted IL-8 and VEGF were analyzed as described in Section “Materials and Methods.” Prior injections, breast pre-adipocytes were differentiated for 12 days and estrogen receptor positive (ER+) BCC were cultured ± β-estradiol (E2) 1 nM for 48 h. All BCC were labeled with 4 µg/ml Fast DiI™ oil red dye. Cells were injected ± anti-IL-8, anti-VEGF, or isotype control at 0.1 mg/ml ± E2 1 nM into the perivitelline space of 2 days old zebrafish embryos, which expressed enhanced green fluorescent protein in endothelial cells. (A) BAd mammospheres alone and low metastatic ER+ MCF-7 ± 90% BAd mammospheres were cultured ± E2 1 nM during 7 days, n = 4–5 in each group. (B) BAd mammospheres alone an ER+ T47D with intrinsically higher metastatic capacity ± 90% BAd mammospheres were cultured ± E2 1 nM during 7 days, n = 5–6 in each group. (C) Estrogen receptor negative (ER−) metastatic MDA-MB-23 ± 90% BAd and BAd mammospheres were cultured during 7 days, n = 4–5 in each group. (D) MCF-7 cells were injected alone or in combination with 50% BAd ± E2 1 nM, tumor angiogenesis was analyzed 3 days post-injections, n = 12–18 in each group. (E) T47D cells were injected alone or in combination with 50% Bad ± E2 1 nM, tumor angiogenesis was analyzed 3 days post-injections, n = 10 in each group. (F) MDA-MB-231 cells were injected alone or in combination with 50% BAd, tumor angiogenesis was analyzed 3 days post-injections, n = 7–10 in each group. Representative confocal images are shown for each cell line. BV = blood vessels. Results are presented as mean ± SEM and analyzed by Student’s t-test, *p < 0.05, **p < 0.01, ***p < 0.001, ****p < 0.0001. Data are representative of at least two independent experiments. |