
Fig. 5
- ID
- ZDB-FIG-180917-38
- Publication
- Nichols et al., 2018 - Ensheathing cells utilize dynamic tiling of neuronal somas in development and injury as early as neuronal differentiation
- Other Figures
- All Figure Page
- Back to All Figure Page
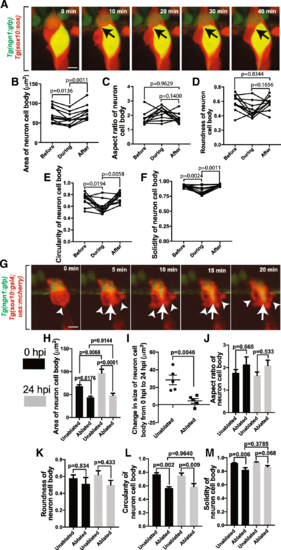
Perturbation of ensheathment impacts DRG neuron shape. (a). Confocal z-projection images from a 24-h timelapse starting at 72 hpf of a Tg(ngn1:gfp), Tg(sox10:eos) zebrafish with photoconverted sox10+ cells. Black arrows denote change in neuronal shape. (B-F). Graphs of area (b), aspect ratio (c), roundness (d), circularity (e), and solidity (f) of the neuron soma before, during, and after the division of an ensheathing cell (n = 11 neurons). (g). Confocal z-projection images from a 24-h timelapse starting at 48 hpf of a Tg(ngn1:gfp), Tg(sox10:gal4; uas:mcherry) zebrafish with photoconverted sox10+ cells and with an ablated ensheathing cell. White arrowheads denote responding ensheathing cells. White arrows denote the change in neuronal shape. (h). Area of the neuronal soma of DRG with ablated and unablated ensheathing cells at 0 hpi (black) and 24 hpi (gray) (n = 5 unablated DRG, n = 5 ablated DRG). (i). Change in the area of the neuronal soma in ablated and unablated DRG from 0 hpi and 24 hpi (n = 5 unablated DRG, n = 5 ablated DRG). (j-m). Graphs of the aspect ratio (j), roundness (k), circularity (l), and solidity (m) of the neuronal soma in ablated and unablated DRG at 0 hpi (black) and 24 hpi (gray) (n = 5 unablated DRG, n = 5 ablated DRG). (b-f) use a paired Tukey’s HSD test. (h,j-m) use an unpaired Tukey’s HSD test. (i) uses an unpaired Student’s t-test, Scale bar is 10 μm (a, g) |