
Fig. 3
- ID
- ZDB-FIG-180913-48
- Publication
- Ashlin et al., 2018 - Pitpnc1a Regulates Zebrafish Sleep and Wake Behavior through Modulation of Insulin-like Growth Factor Signaling
- Other Figures
- All Figure Page
- Back to All Figure Page
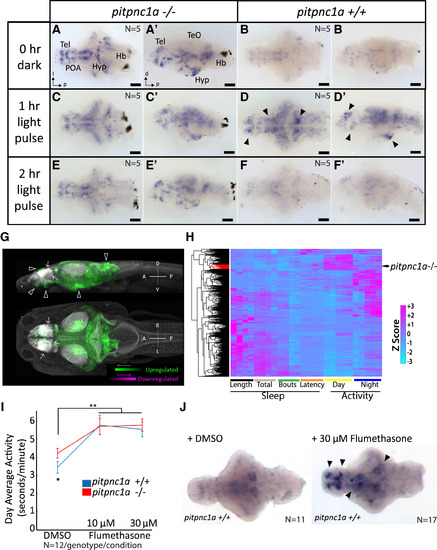
pitpnc1a−/− Brains Have Increased Neuronal Activity (A–B′) ISH reveals many areas of c-fos expression in 6 dpf pitpnc1a−/− larval brains (A and A′) compared with wild-type (B and B′). (C–D′) Following a 1 hr light pulse, additional neurons express c-fos in pitpnc1a−/− (C and C′) and wild-type (D and D′). Many areas expressing c-fos in wild-type after a light pulse overlap with strong c-fos signals in pitpnc1a−/− brains at 0 hr (black arrowheads, D and D′). (E–F′) After 2 hr of light, c-fos levels remain elevated in pitpnc1a−/− brains (E and E′) but have returned to baseline in wild-type (F and F′). (G) pERK/tERK comparison of dark-reared, 6 dpf pitpnc1a−/− (n = 15) and wild-type (n = 12) brains reveals mutant brain areas with upregulated (green) and downregulated (magenta) expression of pERK relative to controls. White arrowheads indicate areas of agreement between pERK and c-fos expression, and white arrows show the downregulated signal. Data are shown as a thresholded maximum projection overlaid on a maximum projection of the Z-Brain tERK reference (gray). (H) Clustering the behavioral fingerprint of pitpnc1a−/− against 550 drug-induced behavioral profiles places the phenotype in a strong day-active and modestly night-active cluster (red branches). (I) Flumethasone increases the behavioral activity of both wild-type and pitpnc1a−/− to the same level. DMSO-treated pitpnc1a−/− animals are hyperactive (∗p < 0.05, one-way ANOVA, Tukey’s post hoc test). Both 10 and 30 μM flumethasone increase larval activity (∗∗p < 0.01, two-way ANOVA, gene × dose, Tukey’s post hoc test). (J) Flumethasone induces c-fos expression in areas similar to pitpnc1a−/− and light pulses (black arrows). Hb, hindbrain; POA, preoptic area. (A–F) Dorsal view. (A′–F′) Lateral view. (J) Ventral view. Scale bars, 100 μm. |
| Gene: | |
|---|---|
| Antibodies: | |
| Fish: | |
| Conditions: | |
| Anatomical Terms: | |
| Stage: | Day 6 |