
Fig. 2
- ID
- ZDB-FIG-180910-38
- Publication
- Bekri et al., 2018 - Glycine Promotes the Survival of a Subpopulation of Neural Stem Cells
- Other Figures
- All Figure Page
- Back to All Figure Page
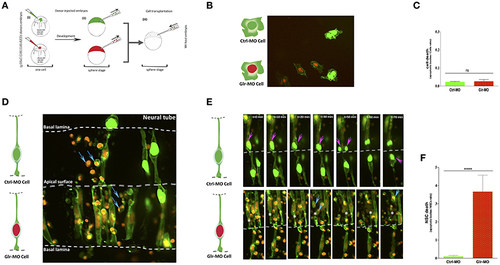
Defects of cell-autonomous glycine signaling induce a specific NSCs loss. (A) Cell transplantation strategy. Donor tg(HuC:Gal4,UAS:RFP) was injected at one-cell by mRNA to target membrane, cell nucleus and Glr-MO or Ctrl-MO as indicated in step (i). At the sphere stage, cells from both conditions were transplanted together in the same host wt embryo in the blastoderm margin (ii and iii). (B) Confocal z-series images of transplanted NSCs. Ctrl-MO transplanted cells showed a normal development to NSCs (NSCs with green membranes and nuclei). However, a considerable of apoptotic bodies were observed in Glr-MO transplanted cells (NSCs with green membranes and red nuclei). The basal and apical surface is outlined by a dotted line and double lines respectively. (C) Live imaging revealed programmed death of NSCs upon glycine signal disruption. Selected frames from 2 h time-lapse sequence of transplanted NSCs development showed a normal interkinetic nuclear migration of Ctrl-MO NSCs followed by cell division (top sequence, magenta arrows). In contrast, some of Glr-MO NSCs showed an arrest movement of interkinetic nuclear migration (bottom sequence, asterisk), followed by fragmentation of NSC to apoptotic bodies (bottom sequence, blue arrows). (D) Quantification of transplanted NSCs death (apoptotic bodies / NSC ratio) in both conditions, Glr-MO (and Ctrl-MO reveal a drastic NSCs death upon disruption of glycine signaling by more than folds. (E) Disruption of glycine signaling does not affect non-neuronal cells survival. Transplanted Glr-MO cells (red nuclei) and Ctrl-MO cells (Green nuclei) were developed naturally to non-neural cells (skin) without showing apoptotic bodies formation. (F) Quantification of transplanted non-neural cell in both conditions, Glr-MO and Ctrl-MO reveal no significant cell death upon disruption of glycine signaling. t-test statistical analysis was performed (n = 6, ****p < 0.0001). |