
Fig. 3
- ID
- ZDB-FIG-180910-31
- Publication
- Chi et al., 2018 - Loss of runx1 function results in B cell immunodeficiency but not T cell in adult zebrafish.
- Other Figures
- All Figure Page
- Back to All Figure Page
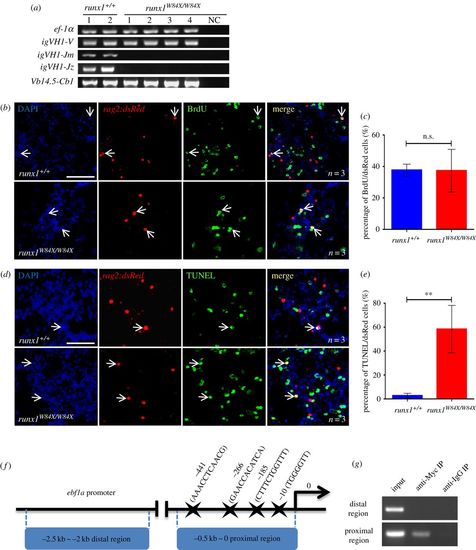
Deficiency of B cells development in runx1W84X/W84X mutants. (a) V(D)J rearrangements of igm, igz and V(DJ)C rearrangement of tcrβ analysis in kidney marrow from runx1+/+ (n = 2) and runx1W84X/W84X mutants (n = 4) by semi-nested PCR. The ef-1α and igVH1-V PCR were used as positive control. NC, negative control. (b–c) Cell proliferation assay of B cells in kidney marrow of runx1+/+ and runx1W84X/W84X mutants. (b) Triple staining of DAPI, rag2:dsRed and BrdU. Blue: DAPI, red: dsRed, green: BrdU; arrows indicate DAPI staining, rag2:dsRed staining, BrdU staining and triple co-staining cells. (c) Comparison of percentage of rag2:dsRed+ cells for BrdU co-staining cells between runx1+/+ (blue bar, n = 3) and runx1W84X/W84X mutants (red bar, n = 3). Unpaired Student's t-test; p < 0.05; ns, no significance; mean ± s.e.m. (d–e) Cell apoptosis assay of B cells in kidney marrow of runx1+/+ and runx1W84X/W84X mutants. (d) Triple staining of DAPI, rag2:dsRed and TUNEL. Blue: DAPI, red: dsRed, green: TUNEL; arrows indicate DAPI staining, rag2:dsRed staining, TUNEL staining, and triple co-staining cells. (e) Comparison of percentage of rag2:dsRed+ cells for TUNEL between runx1+/+ (blue bar, n = 3) and runx1W84X/W84X mutants (red bar, n = 3). (f) Schematic diagram of the 2.5 kb ebf1a promoter region. The transcription initiation site is designated as 0. Putative Runx1 consensus sites (marked by stars) are shown. (g) Semi-quantitative PCR analysis of the enrichment of the −0.5 ∼ 0 kb proximal region (ii) and the −2.5 ∼ −2 kb distal region (i). The left lanes were input DNA control. Each experiment was performed in duplicate. Unpaired Student's t-test; mean ± s.e.m; **p < 0.01; scales bars, 100 µm. |
| Fish: | |
|---|---|
| Observed In: | |
| Stage: | Adult |