
Fig. 8
- ID
- ZDB-FIG-180910-13
- Publication
- Early et al., 2018 - An automated high-resolution in vivo screen in zebrafish to identify chemical regulators of myelination
- Other Figures
- All Figure Page
- Back to All Figure Page
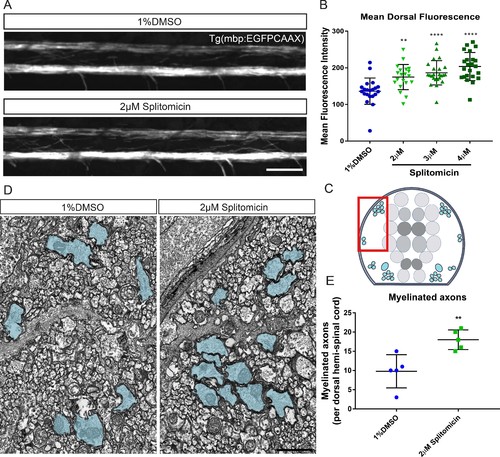
Treatment with splitomicin increases spinal cord myelination in vivo. (A) Representative images of myelin within the spinal cord of control (top) and splitomicin-treated (bottom) Tg(mbp:EGFP-CAAX) larvae. Scale bar, 50 μm (B) Quantification of mean fluorescence intensity throughout the entire dorsal spinal cord demonstrates a significant increase following 2–4 μM splitomicin treatment from 2-4 dpf. (C) Schematic of a transverse section through the zebrafish spinal cord shows the position of myelinated axons (blue) in relation to the gray matter (neuronal cell bodies are coloured in grey). Red box indicates approximate area shown in (D) in which myelinated axon number was quantified. (D): Transmission electron micrographs of control (left) and splitomicin-treated (right) larvae at 4 dpf with myelinated axons pseudo-coloured in blue. Scale bar, 1 μm (E) Numbers of myelinated axons in the dorsal spinal cord are significantly increased following 2–4 dpf treatment with 2 μM splitomicin. **p<0.01, ****p<0.0001. Error bars represent means ± s.d. |