
Fig. 5
- ID
- ZDB-FIG-180910-10
- Publication
- Early et al., 2018 - An automated high-resolution in vivo screen in zebrafish to identify chemical regulators of myelination
- Other Figures
- All Figure Page
- Back to All Figure Page
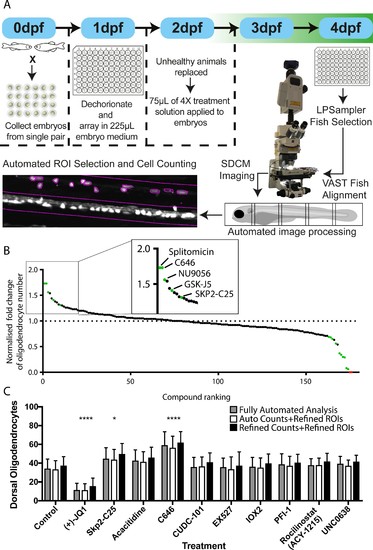
Automated chemical screening pipeline in zebrafish identifies novel regulators of oligodendrocyte development. (A) Schematic of chemical screening pipeline. (B) Results of primary screen displayed as normalised fold change in oligodendrocyte number relative to matched DMSO-treated controls and ranked by cell increase for all 183 treatments (146 unique compounds) with hit compounds that increase or decrease cell number marked in green and toxic compounds in red. Inset shows ranking of compounds that significantly increased oligodendrocyte cell number. See also Table 2 and Supplementary file 1 (C) Quantification of dorsal oligodendrocyte number from a single screening session showing comparison of different analysis methods. *p<0.05, ****p<0.0001. Error bars represent means ± s.d. |