|
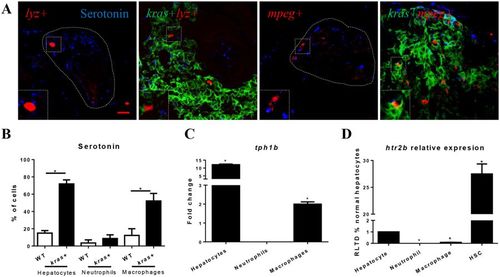
Determination of serotonin in hepatocytes, neutrophils and macrophages. (A) Representative images of IF staining of serotonin in liver sections of kras+/lyz+, lyz+ (control), kras+/mpeg+ and mpeg+ (control) larvae (6 dpf). Livers in wildtype larvae are outlined by dash lines. Scale bars: 20 μm. (B) Quantification of serotonin+ hepatocytes, neutrophils and macrophages. (C) Comparison of tph1b expression change after krasV12 induction in hepatocytes, neutrophils and macrophages. (D) Predominant expression of htr2b mRNA in HSCs. Htr2b mRNAs were measured and compared in hepatocytes, neutrophils, macrophages and HSCs with the level expression in hepatocytes was arbitrarily set as 1. Insets in (A) are enlarged view of representative staining signals in the liver. In all experiments, n = 20 for each group. *P < 0.05. Error bars represent biological replicates in (B) and technical replicates in (C) and (D). Scale bars: 20 μm.
|