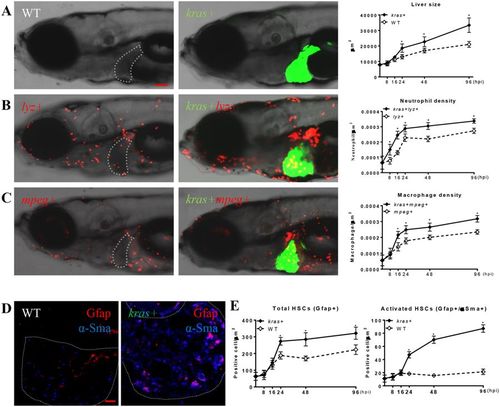
Rapid modification of tumor microenvironment following oncogenic krasV12 expression. Kras+ fish were crossed with lyz+ or mpeg+ fish. Larvae from the crosses were treated with 20 μg/ml dox from 3 dpf and fixed at 8, 16, 24, 48, 96 hpi. At each time point, 10 fish/group were mounted in methylcellulose and imaged at left lateral side under a confocal microscope. Neutrophils, macrophages and HSCs were counted manually based on DsRed/mCherry fluorescence and Gfap or α-Sma staining. (A) Representative images of the WT (left) or kras+ (middle) larvae at 96 hpi and quantification of 2D liver size (right) from 8 hpi to 96 hpi, (B) Representative images of lyz+ larvae in the WT (left) or kras+ (middle) background at 96 hpi and quantification of neutrophil density in the liver from 8 hpi to 96 hpi. (C) Representative images of mpeg+ larvae in the WT (left) or kras+ (middle) background at 96 hpi and quantification of macrophage density in the liver from 8 hpi to 96 hpi. (D) Representative images of IF co-staining of GFAP (red) and α-Sma (blue) in liver sections of zebrafish larvae at 96 hpi. (E) Quantification of total HSC number (Gfap+) and activated HSCs (Gfap+ and α-Sma+) in liver sections in larvae from 8 hpi to 96 hpi. Livers are outlined when GFP signal is not available. In all experiments, n = 20 for each group. *P < 0.05. Error bars represent biological replicates. Scale bars: 20 μm.
|
