
Fig. S3
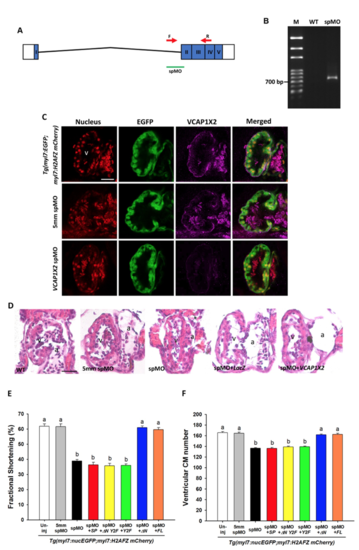
VCAP1X2 morphant embryos exhibited similar cardiac defects to VCAP1X2 mutant embryos. (A) A diagram of VCAP1X2 spMO target site at the boundary between intron 1 and exon 2 is shown. (B) Splicing of exon 1 and exon 2 was disrupted in VCAP1X2 morphant compared to wild-type (WT) embryos, indicated by the 702 bp RT-PCR product using forward and reverse primers indicated by red arrows in (A). (C) Expression of EGFP or VCAP1X2 in ventricles of hearts in Tg(myl7: EGFP; myl7: H2AFZ mcherry), 5mm spMO-injected, and VCAP1X2 spMO-injected embryos. Higher VCAP1X2 expression was detected in the heart ventricle in Tg (myl7: EGFP; myl7: H2AFZ mcherry) embryos and 5mm spMO-injected embryos. No VCAP1X2 expression was detected in the VCAP1X2 spMO-injected embryos at 96 hpf (n = 15 per condition, N = 3). v, ventricle. Scale bar, 30 μm. (D) Paraffin sections stained with hematoxylin and eosin showed thinner ventricular compact layer in VCAP1X2 spMO-injected morphants compared to un-injected wild-type (WT) or 5mm spMO-injected control embryos at 120 hpf. Such defects could be rescued by co-injection with full-length (FL) VCAP1X2 but not with LacZ mRNA (n = 10 per condition). Scale bar, 25 μm. v, ventricle, a, atrium. (E) VCAP1X2 spMO-injected Tg(myl7:EGFP; myl7:H2AFZ mCherry) embryos exhibited decreased ventricular fractional shortening in the heart compared to un-injected or 5mm spMO-injected transgenic embryos and co-injection of △N or full-length (FL) VCAP1X2 mRNA, but not SP, △N Y2F or Y2F VCAP1X2 mRNA, could rescue decreased ventricular fractional shortening in the heart of VCAP1X2 spMO-injected transgenic embryos at 72 hpf (n = 20 per condition, N = 3). Error bars indicate standard error. (F) VCAP1X2 spMO-injected Tg(myl7:EGFP; myl7:H2AFZ mCherry) embryos exhibited reduced ventricular cardiomyocyte (CM) number compared to uninjected or 5mm spMO-injected transgenic embryos at 72 hpf. The defect could be rescued by co-injection of △N or full-length (FL) VCAP1X2 mRNA, but not SP, △N Y2F or Y2F VCAP1X2 mRNA (n = 20 per condition, N = 3). Error bars indicate standard error. Quantitative data were analyzed by ANOVA with Bonferroni multiple comparisons. Treatments that are not statistically different (α = 0.05) from each other are labeled with the same letter. |