
Fig. 1
- ID
- ZDB-FIG-180713-3
- Publication
- Almeida et al., 2018 - Myelination of Neuronal Cell Bodies when Myelin Supply Exceeds Axonal Demand
- Other Figures
- All Figure Page
- Back to All Figure Page
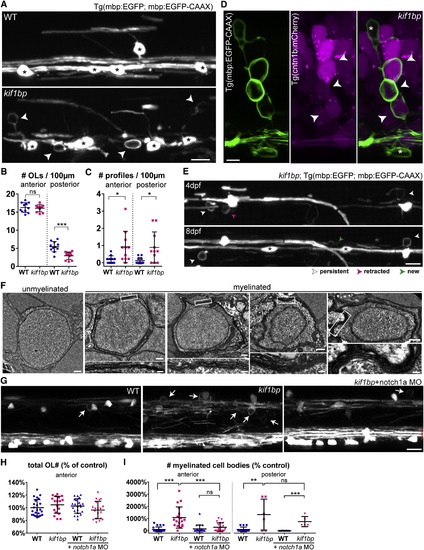
Oligodendrocytes in Excess of Target Axons Ectopically Myelinate Neuronal Cell Bodies in kif1bp Mutants (A) Double myelin and oligodendrocyte reporter showing oligodendrocytes (asterisks) and ectopic profiles (arrowheads) in the spinal cord (4 dpf). (B) Oligodendrocyte number (per 100 μm length of spinal cord) is normal in the anterior but reduced in the posterior spinal cord of kif1bp mutants (p = 0.688 anterior; p = 0.0001 posterior; n = 11 wild-type [WT] and n = 11 mutants; t test). (C) Profile number is increased in mutants (p = 0.018 anterior; p = 0.011 posterior; n = 11 WT and n = 11 mutants; t test). (D) Double myelin and neuronal reporter showing mCherry+ neurons enwrapped by EGFP+ myelin (arrowheads) in 4 dpf mutants. Asterisk, oligodendrocyte cell body. (E) Time course of double oligodendrocyte and myelin reporter in kif1bp mutant. Asterisks denote new oligodendrocytes. (F) Transmission electron microscopy (TEM) of a typical unmyelinated cell body and four myelinated cell bodies in 6 dpf mutants. (G) 4 dpf anterior spinal cord of oligodendrocyte and myelin reporter showing that increased ectopic profiles (arrows) in mutants are rescued by presence of additional Mauthner axons (red brackets) when injected with notch1a morpholino (MO). (H) Oligodendrocyte number (normalized to control average) is normal in all conditions (p[kif1bp-WT] = 0.267; p[WT+notch1a MO-WT] = 0.483; p[kif1bp+notch1aMO-WT] = 0.374; p[kif1bp+notch1aMO-kif1bp] = 0.071; n = 23 WT; n = 18 kif1bp; n = 22 WT+notch1a MO; n = 19 kif1bp+notch1a MO; t tests). (I) Myelinated cell body number (normalized to control average) is increased in mutants (p[WT-kif1bp] < 0.0001, n = 23 WT and n = 18 kif1bp anterior; p[WT-kif1bp] = 0.0019, n = 14 WT and n = 6 kif1bp posterior; t tests) and is rescued by additional Mauthner axons in anterior (p[kif1bp+notch1a MO-kif1bp] = 0.0008, n = 18 kif1bp and n = 19 kif1bp+notch1a MO; t test), but not posterior, spinal cord of mutants (p[kif1bp+notch1a MO-kif1bp] = 0.359, n = 6 kif1bp and n = 5 kif1bp+notch1a MO; t test). All graphs display mean and SD. OL, oligodendrocyte. The scale bars represent 10 μm (A, E, and G), 5 μm (D), 0.5 μm (F, whole cell), and 0.1 μm (F, myelin detail). See also Movies S1 and S2. |
| Genes: | |
|---|---|
| Fish: | |
| Knockdown Reagent: | |
| Anatomical Terms: | |
| Stage Range: | Day 4 to Days 7-13 |
| Fish: | |
|---|---|
| Knockdown Reagent: | |
| Observed In: | |
| Stage Range: | Day 4 to Days 7-13 |