
Fig. 1
- ID
- ZDB-FIG-180710-45
- Publication
- Kenyon et al., 2018 - Generation of a double binary transgenic zebrafish model to study myeloid gene regulation in response to oncogene activation in melanocytes
- Other Figures
- All Figure Page
- Back to All Figure Page
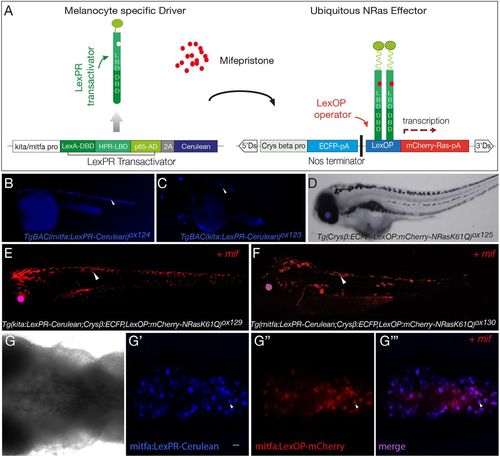
LexPR mifepristone-inducible model for melanocyte oncogenic activation. (A) Diagram of LexPR/LexOP inducible system. The LexPR driver cassette consists of LexPR transactivator and a Cerulean reporter under the control of melanocyte-specific promoters, kita or mitfa. The effector cassette contains the Lex operator sequence (LexOP) fused to the mCherry–Ras-oncogene. mCherry-Ras fusion is transcribed in trans only in the presence of mifepristone, when the LexPR transactivator-mifepristone complex binds to the LexOP sequence upstream of the oncogene expression cassette. (B,C) mitfa:LexPR-Cerulean [TgBAC(mitfa:LexPR-Cerulean)ox124] and kita:LexPR-Cerulean [TgBAC(kita:LexPR-Cerulean)ox123] transactivator driver lines were characterised by expression of LexPR transactivator and its cognate fluorescent protein Cerulean specifically in melanocytes. (D) LexOP:mCherry-NRas effector line [Tg(Crysβ:ECFP-LexOP:mCherry-NRasQ61K)ox125] shows ECFP expression in the eye, but no oncogene transcription. (E,F) The melanocyte-specific expression of mCherry-NRas in transgenic larvae harbouring both a transactivation driver and an oncogene effector allele [Tg(kita/mitfa:LexPR-Cerulean;LexOP:mCherry-NRasQ61K)ox129/ox130] is activated by addition of 1 μM mifepristone to the embryo rearing solution. (G-G‴). Confocal z-stack projection of the dorsal view of the melanocytes in the hindbrain region of a Tg(mitfa:LexPR-Cerulean;LexOP:mCherry-NRasQ61K)ox130 transgenic larvae shows brightfield view (G). LexPR-Cerulean fusion (blue) (G′) and mifepristone-dependent activation of LexOP:mCherry-NRasQ61K fusion (red) (G″) and the overlap (purple) (G‴). Larvae were partially bleached to attenuate the pigment and the mCherry signal was amplified with an anti-Cherry antibody. White arrowheads show Cerulean and mCherry signal localised to the melanocytes. Scale bar: 25 μm. |
| Genes: | |
|---|---|
| Fish: | |
| Condition: | |
| Anatomical Term: | |
| Stage: | Day 5 |