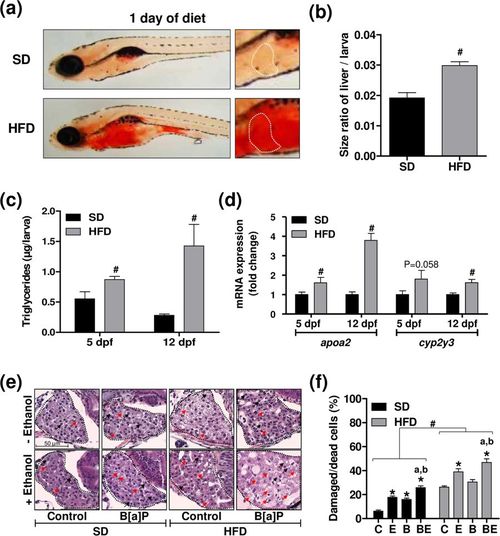
Induction of steatosis in zebrafish larvae under high-fat diet and exacerbation of liver damage severity upon co-exposure in larvae with steatosis. Zebrafish larvae were fed with a standard diet (SD) or a high-fat diet (HFD) from 4 dpf until 5 dpf (a–d) or until 12 dpf (c–f). Lipid accumulation (a) was analyzed after oil red O staining in HFD larvae as well as in SD larvae. White dotted line in the right-hand side panels outlines liver in the 2x-magnifications. (b) From images acquired in (a), the ratio of liver sizes to whole larva sizes was determined on 5 dpf zebrafish larvae. Images are representative of at least 3 larvae. Triglyceride content (c) as well as mRNA levels of apoa2 and cyp2y3 (d) were determined in SD and HFD larvae. In (d), data are expressed relative to mRNA level found in SD larvae, arbitrarily set at 1 unit for each time (5 and 12 dpf). (e,f) From 5 dpf, SD and HFD zebrafish were either left untreated (C), or treated with 25 nM B[a]P (B), 43 mM ethanol (E) or a combination of both toxicants (BE) for 7 days. (e) Liver damages were evaluated on zebrafish liver section after HES staining (magnification x400). Black dotted line outlines liver. Damaged/dead cells were indicated by red arrows for hepatocyte dropouts, and by black arrows for ballooned or vacuolated hepatocytes. Images are representative of at least 3 larvae. Values are the mean ± SEM of at least three independent experiments or larvae. (f) From images obtained in (e), histological count of damaged cells was realized. (b–d) #Significantly different from SD larvae. (f) #Significantly different from SD larvae; *Significantly different from untreated SD or HFD larvae; aSignificantly different from larvae treated by ethanol only; bSignificantly different from SD or HFD larvae treated by B[a]P only.
|
