
Fig. S2
- ID
- ZDB-FIG-180706-11
- Publication
- Siddam et al., 2018 - The RNA-binding protein Celf1 post-transcriptionally regulates p27Kip1 and Dnase2b to control fiber cell nuclear degradation in lens development
- Other Figures
- All Figure Page
- Back to All Figure Page
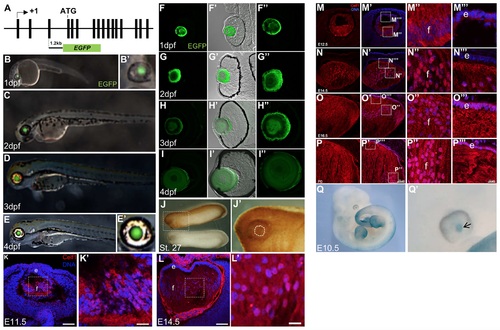
celf1 reporter gene analysis and protein expression in developing vertebrate lens. (A) Schematic of the zebrafish celf1 gene (not drawn to scale) shows the location of the ~1.2kb potential enhancer in the genomic region upstream of the start codon (which is located in exon 4). This ~1.2kb celf1 genomic region is fused to EGFP in the plasmid construct that is used in the reporter assays. (B to E’) Lens-specific expression of EGFP in zebrafish indicates strong celf1 enhancer activity at (B, B’) 1dpf, (C) 2dpf, (D) 3dpf and (E, E’) 4dpf. (F to I”) Transverse sections of zebrafish eye exhibit high EGFP expression at (F to F”) 1dpf, (G to G”) 2dpf, (H to H”) 3dpf and (I to I”) 4dpf. (J) In Xenopus laevis, at St. 27, high celf1 protein expression is present. (J’) High-magnification of dotted line area in J. Dotted-line circle shows lens region. (K and L) In mouse lens, high Celf1 protein expression is detected by a mouse monoclonal Celf1 antibody at stages E11.5 and E14.5. Fiber cells (f) and epithelium (e). (K’ and L’) High-magnification of dotted-line area in K and L, respectively. (M-P”‘) In mouse lens, rabbit Celf1 antibody detects Celf1 protein in lens development at stages E12.5, E14.5, E16.5 and P0. High magnification in dotted area is shown. In early stages, Celf1 protein is detected predominantly in fiber cells (f), and at later stages, while it retains high fiber cell expression, it is also detected in the epithelium (e). (Q) Celf1lacZKI/+ mouse reporter analysis reveals β-galactosidase activity in the lens at embryonic stage E11.5, indicative of endogenous Celf1 promoter/enhancer driven gene expression. (Q’) High-magnification of eye region in M’ shows high β-galactosidase activity in the lens (arrow). Scale bar in K and L is 75 μm while in K’ and L’ is 12 μm. |
| Gene: | |
|---|---|
| Fish: | |
| Anatomical Terms: | |
| Stage Range: | Prim-5 to Day 4 |