
Fig. 2
- ID
- ZDB-FIG-180705-26
- Publication
- Haehnel-Taguchi et al., 2018 - Projections of the Diencephalospinal Dopaminergic System to Peripheral Sense Organs in Larval Zebrafish (Danio rerio).
- Other Figures
- All Figure Page
- Back to All Figure Page
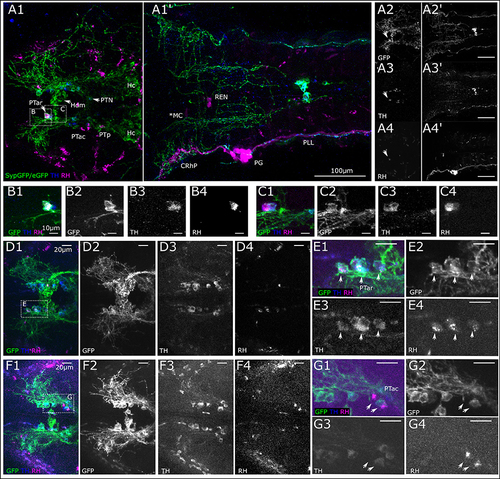
Retrograde labeling of PLL nerve marks DA neurons in the posterior tuberculum. (A) Dorsal view montages from two tiles (A1,A1') of MIPs from different substacks of larval head (total depth of 313 μm, step size 1 μm). (A1) MIP (slices 185–240) posterior tuberculum (PT) and hypothalamus (H), revealing triple stained cell efferent to the lateral line in the anterior rostral PT (PTar cluster, marked with arrow). Further DA cell clusters: anterior caudal PT (PTac), medial dorsal H (Hdm), posterior PT (PTp), posterior tuberal nucleus (PTN) and caudal H (Hc). SypGFP/eGFP-CAAX driven by th:Gal4-VP16: green, TH immunoreactivity: blue. (A1') MIP (slices 80–150) showing backfill of lateral line neurons. Rhodamine dextran (magenta) was injected into the posterior lateral line nerve (PLL); afferent neurons are labeled along the nerve, in the posterior lateral line ganglion (PG) and central rhombencephalic projection (CRhP). Efferent neurons are labeled rhombencephalic efferent neurons (REN), asterisk marks lateral dendrite of the Mauthner cell (MC), which has also faintly taken up dye. SypGFP/eGFP-CAAX expression (A2,A2'). TH-immunoreactivity (A3,A3'). Retrograde Rhodamine dextran labeling (A4,A4'). All scale bars: 100 μm. (B). Magnification of region as indicated in (A1) with Rhodamine dextran backfilled, TH and GFP immunoreactive DA PTar cell. MIP of substack (total depth of 16 μm). (C). Substack from MIP of region indicated in (A1), ventrally of (B) (total depth 16 μm) revealing two more rhodamine labeled cells in the PTar cluster. Scale bars (B,C): 10 μm. (D). Dorsal view of MIP of DA-cell clusters in PT with three Rhodamine dextran backfilled, TH and GFP immunoreactive DA cells (step size: 1 μm, total depth of 35 μm). (E). Magnification of region indicated in (D1). MIP of PTar cell bodies (total depth of 17 μm). (F). Dorsal view (MIP) of DA-cell clusters in PT with two Rhodamine dextran backfilled, TH and GFP immunoreactive DA PTac cells (step size: 1 μm, total depth of 35 μm). (G). Magnification of region indicated in (F1). MIP of PTac cell bodies (total depth of 13 μm). Scale bars (D–G): 20 μm. Pseudo coloring and sub-panels in (B–G) as described in (A), all panels labeled GFP show expression of SypGFP/eGFP-CAAX detected by anti GFP immunofluorescence. Step size for all: 1 μm. |