
Fig. 2
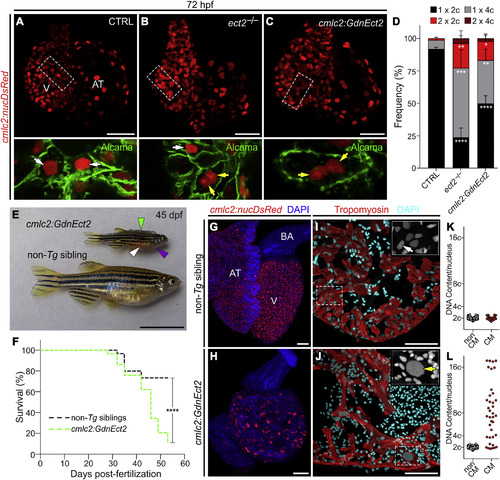
Loss of Ect2 Function Causes Polyploidization of Zebrafish Cardiomyocytes (A–C) Confocal projections of 72-hpf embryonic hearts from control (CTRL), ect2−/−, and Tg(cmlc2:GdnEct2) animals carrying the Tg(cmlc2:nucDsRed) transgene. Single confocal planes of boxed regions are shown at higher magnification with Alcama immunostaining to highlight plasma membranes. White and yellow arrows indicate diploid and polyploid cardiomyocytes, respectively. See also Figures S3 and S4A–S4F. (D) Quantification of indicated cardiomyocyte populations in the indicated cohorts at 72 hpf (mean ± SD, n = 4, 4, and 4 embryos for ect2+/+, ect2−/−, non-Tg, and Tg(cmlc2:dnEct2), respectively. ∗∗∗∗p < 0.0001; ∗∗∗p < 0.001; ∗∗p < 0.01; ∗p < 0.05 by one-way ANOVA followed by Tukey's multiple comparisons test). (E) 45-dpf (e19.5 mm SSL) Tg(cmlc2:GdnEct2) and non-Tg sibling animals with arrowheads highlighting scale bristling (green), blood pooling (white), and pericardial edema (purple) in Tg(cmlc2:dnEct2) zebrafish. 68 of 77 Tg(cmlc2:GdnEct2) and none of 88 non-Tg siblings developed these phenotypes. (F) Representative Kaplan-Meier plot for Tg(cmlc2:GdnEct2) and non-Tg clutchmates from one of three independent experiments. 77 total Tg(cmlc2:GdnEct2) animals and 88 total siblings were followed. ∗∗∗∗p < 0.0001, log-rank test. (G and H) Confocal projections of DAPI-stained whole hearts from 30-dpf non-Tg or Tg(cmlc2:GdnEct2) animals carrying the Tg(cmlc2:nucDsRed) reporter. 19 of 25 transgenic animals showed this phenotype with 6 of 25 showing an intermediate phenotype. (I and J) Ventricular sections from 30-dpf non-Tg or Tg(cmlc2:GdnEct2) animals immunostained to detect tropomyosin and counterstained with DAPI. Boxed regions show DAPI staining at higher magnification. White and yellow arrows indicate diploid and polyploid cardiomyocytes, respectively. (K and L) Nuclear DNA content distributions of non-cardiomyocyte and cardiomyocyte populations from indicated cohorts. Representative data are shown from one of four replicates, one heart per replicate. See also Figures S4G–S4I. AT, atrium; BA, bulbus arteriosus; V, ventricle; Scale bars, 25 μm (A–C, G, and H), 10 mm (E), and 100 μm (I and J). |
| Gene: | |
|---|---|
| Fish: | |
| Anatomical Term: | |
| Stage Range: | Protruding-mouth to Days 30-44 |
| Fish: | |
|---|---|
| Observed In: | |
| Stage Range: | Protruding-mouth to Days 45-89 |
Reprinted from Developmental Cell, 44, González-Rosa, J.M., Sharpe, M., Field, D., Soonpaa, M.H., Field, L.J., Burns, C.E., Burns, C.G., Myocardial Polyploidization Creates a Barrier to Heart Regeneration in Zebrafish, 433-446.e7, Copyright (2018) with permission from Elsevier. Full text @ Dev. Cell