
Fig. 2
- ID
- ZDB-FIG-180620-71
- Publication
- Murphy et al., 2018 - Placeholder Nucleosomes Underlie Germline-to-Embryo DNA Methylation Reprogramming
- Other Figures
- All Figure Page
- Back to All Figure Page
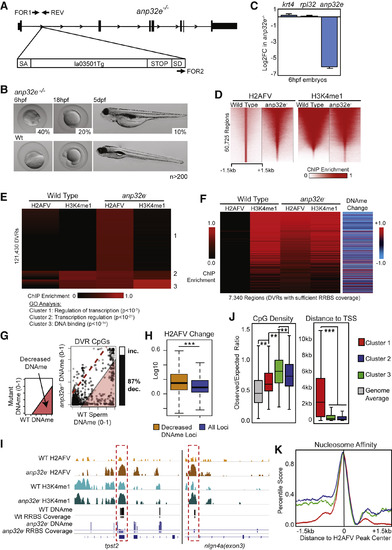
A Null Mutation for anp32e Causes Increased Genomic H2AFV and Decreased DNA Methylation in Sperm (A) Scheme for the anp32e mutant allele. A gene trap cassette (la013501Tg) within the anp32e gene causes premature translation termination. PCR primers are indicated. (B) anp32e−/− homozygotes display a variety of phenotypes. Lethality occurs at the displayed stages. 30% are viable and fertile. (C) anp32e mRNA in the anp32e mutants. An early zygotically transcribed gene (krt4) and a housekeeping gene (rpl32) are unaffected. Error bars represent SD. (D) H2AFV enrichment regions become more broad in anp32e− sperm. Heatmaps for H2AFV and H3K4me1 (normalized enrichment) are displayed at all WT sperm H2AFV peaks. (E) anp32e− sperm display ectopic H2AFV localization. H2AFV and H3K4me1 enrichment (Z scores) is displayed as a heatmap. Differential variant regions (DVRs) were analyzed and segregate into 3 clusters by K-means clustering. Results of GO analysis for affected gene categories is shown below. (F) Heatmaps indicate DNA methylation decreases at the majority of DVRs. Displayed regions are only those with sufficient read depth from RRBS-seq assays (see the STAR Methods). (G) Individual CpGs within DVRs indicate decreased DNAme. Scatterplot of mutant versus control is displayed with a bar graph quantifying changing CpGs (>20% absolute change), and the percentage decreasing DNA methylation is shown. (H) H2AFV increases more at regions at which DNA methylation decreases. Boxplots of log10FE values are shown. ∗∗∗ p < 0.001. (I) Browser snapshots are displayed for WT and anp32e− sperm. Regions with sufficient coverage for DNA methylation data are indicated with bars beneath each track. Ectopic H2AFV accumulation is highlighted with red dashed boxes. log10FE data are from 0–1 for ChIP-seq and DNA methylation fraction from 0–1. (J) Analysis of CpG density (left) and neighboring gene proximity distance (right) for clusters identified in (E). t tests: ∗∗ p < 0.01, ∗∗∗ p < 0.001. Boxplots are displayed. (K) Analysis of predicted nucleosome affinity at DVRs. Regions from (E) were grouped by cluster and colored like in (J). See also Figure S2. |
| Gene: | |
|---|---|
| Fish: | |
| Anatomical Term: | |
| Stage: | Shield |
| Fish: | |
|---|---|
| Observed In: | |
| Stage Range: | Shield to Day 5 |
Reprinted from Cell, 172(5), Murphy, P.J., Wu, S.F., James, C.R., Wike, C.L., Cairns, B.R., Placeholder Nucleosomes Underlie Germline-to-Embryo DNA Methylation Reprogramming, 993-1006.e13, Copyright (2018) with permission from Elsevier. Full text @ Cell