
Fig. 4
- ID
- ZDB-FIG-180524-4
- Publication
- Koide et al., 2018 - Terminal Nerve GnRH3 Neurons Mediate Slow Avoidance of Carbon Dioxide in Larval Zebrafish
- Other Figures
- All Figure Page
- Back to All Figure Page
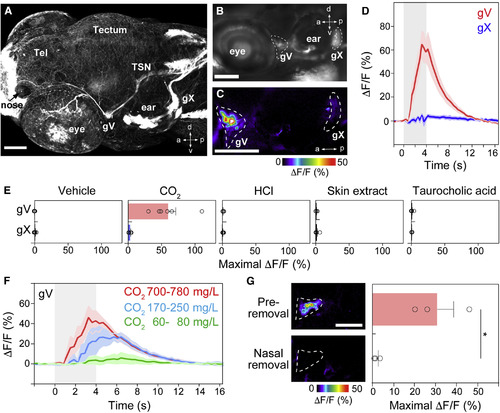
CO2 Activates the Trigeminal Pathway (A) Dorsolateral view of Tg(Gal4s1102t;UAS:gapGFP) zebrafish larva expressing membrane-tethered GFP in the trigeminal ganglion (gV) neurons and their axons. GFP expression is also observed in other peripheral neurons, including the vagal ganglion (gX). Scale bar, 100 μm. (B) Lateral view of Tg(Gal4s1102t;UAS:G-CaMP7) zebrafish larvae expressing G-CaMP7 in the trigeminal ganglion and gX. Scale bar, 100 μm. (C) Representative image of the calcium increase in trigeminal ganglion neurons after CO2 application. The gX did not respond to CO2. Scale bar, 100 μm. (D) Temporal dynamics of G-CaMP7 fluorescence (ΔF/F) in the trigeminal ganglion and gX upon application of CO2 to the nose. Mean ΔF/F (solid line) and SEM (transparency) (n = 6). Gray-shaded areas indicate the period of CO2 application (4 s). (E) Bar graphs showing the maximal ΔF/F evoked by various chemical stimuli in the trigeminal ganglion and gX. Values represent mean ± SEM (n = 6). (F) Temporal dynamics of G-CaMP7 fluorescence (ΔF/F) in the trigeminal ganglion upon the application of different concentrations of CO2. Mean ΔF/F (solid line) and SEM (transparency) (n = 6). Low CO2 (60–80 mg/L, green), middle CO2 (170–250 mg/L, blue), and high CO2 (700–780 mg/L, red). Gray-shaded areas indicate the period of CO2 application (4 s). (G) Elimination of the CO2-evoked trigeminal ganglion activation by nasal ablation. Left: representative images of G-CaMP7 fluorescence changes in response to CO2 before (top) and after (bottom) nasal ablation. Scale bar, 50 μm. Right: bar graph showing the CO2-evoked maximal ΔF/F before (top) and after (bottom) the nasal ablation. Values represent mean ± SEM (n = 3). Paired t test; ∗p < 0.05. See also Figure S4. |